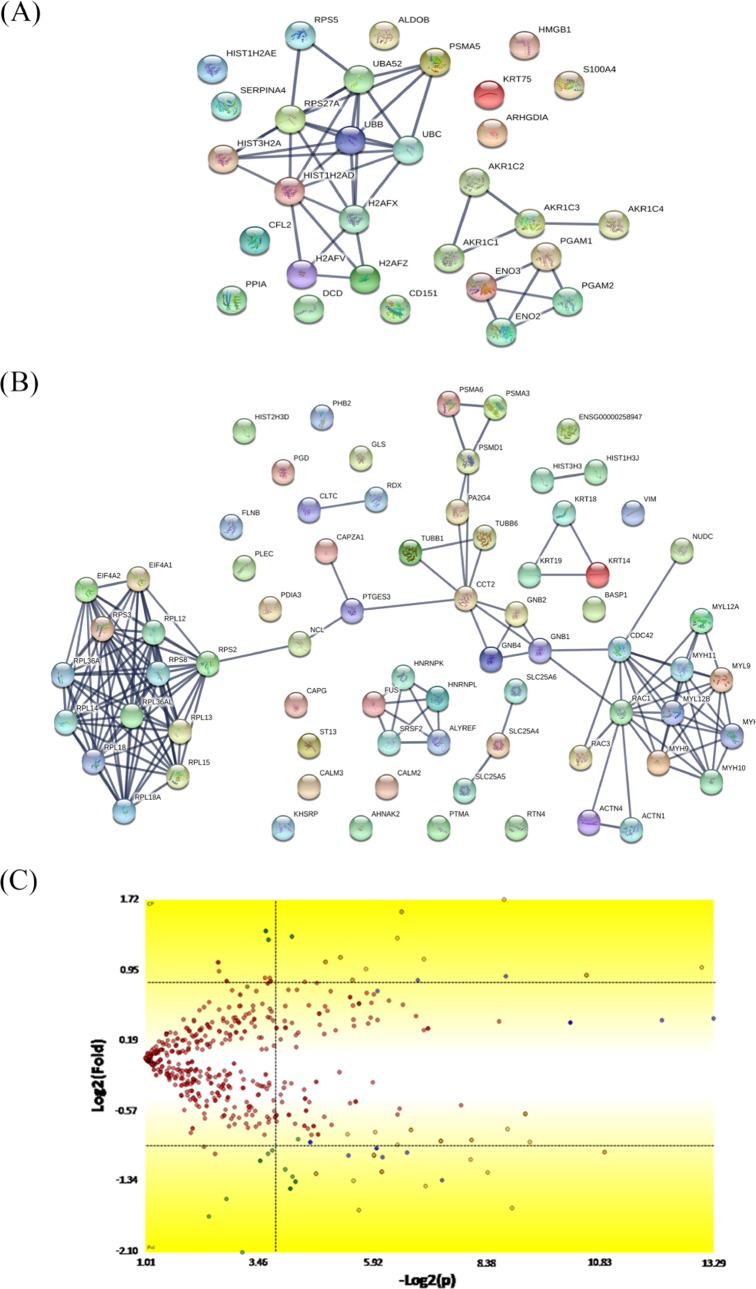
Figure 5.
Mapping of the protein association network in P-MAPA + IL-12-treated SKOV-3 cells. Source of the protein–protein interaction is based on cellular processing and its related molecular systems. Thicker lines show the highest confidence score (0.900) for upregulated (A) and downregulated (B) molecules of a functional association in response to P-MAPA + IL-12 therapy in SKOV-3 cells. (C) Volcano plot indicates large magnitude fold-changes (y-axis) and statistical significance (p-value, x-axis); this plot indicates log 2 fold change vs −log 2 FDR-corrected p-value. Differentially expressed proteins are shown in the upper and lower right areas. See legends in Table 3.

