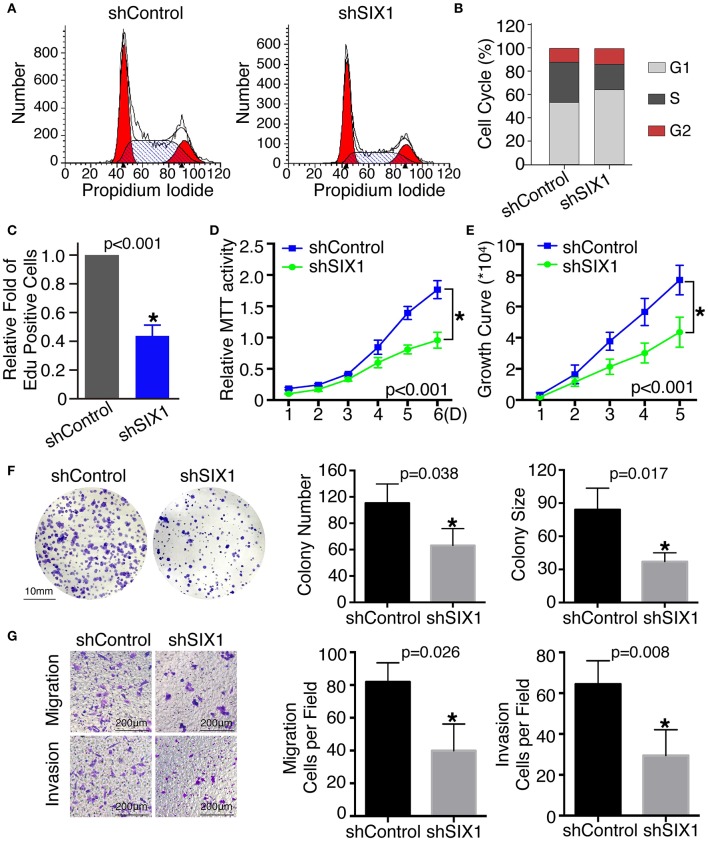
Figure 3.
Knockdown SIX1 decreased the proportion of cells in S phase and inhibited proliferation, migration, and invasion in TPC-1 cell lines. Representative images of cell cycle plot (A) and quantitative results (n = 3) (B). Quantitative results of EdU staining of cells with SIX1 knockdown (n = 3) (C). MTT assays of TPC-1 cells after silencing SIX1 (n = 5) (D). Growth curve assays of TPC-1 cells after silencing SIX1 (n = 5) (E). Representative images of colony formation assays of TPC-1 cells after silencing SIX1 and quantitative results (n = 3) (F). The representative images of migration and invasion assay in TPC-1 cells after silencing SIX1 and quantitative analysis (n = 3) (G). *p < 0.05.

