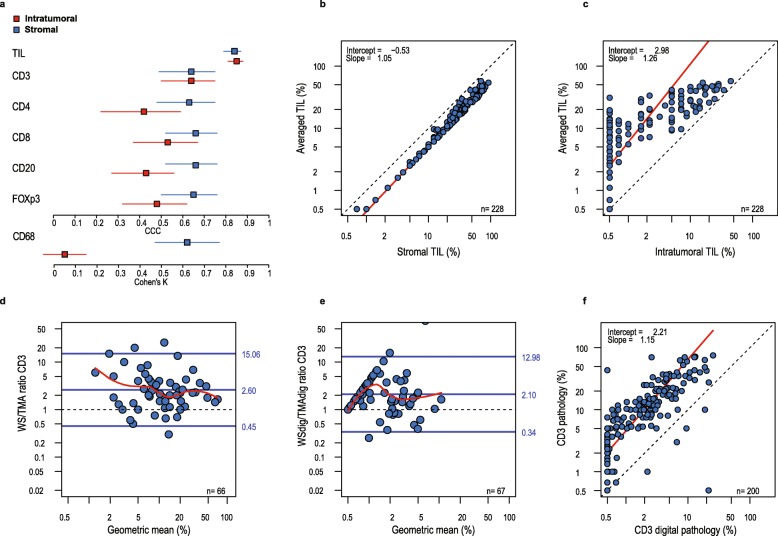
Fig. 1.
Reliability of standard microscopic pathology and digital analysis to estimate the immune composition. a Forest plots representing estimated concordance correlation coefficients with 95% confidence interval (CI) for each pairing between pathologists (inter-observer agreement) on H&E and whole slides (WS). CCC (95% CI): sTIL, 0.84 (0.79–0.87); itTIL, 0.85 (0.81–0.88); sCD3, 0.64 (0.49–0.75); itCD3, 0.64 (0.50–0.75); sCD4, 0.63 (0.48–0.75); itCD4, 0.42 (0.22–0.59); sCD8, 0.66 (0.52–0.76); itCD8, 0.53 (0.37–0.67); sCD20, 0.66 (0.52–0.76); itCD20, 0.43 (0.27–0.56); sFOXP3, 0.65 (0.50–0.76); and itFOXP3, 0.48 (0.32–0.62). Cohen’s K for the macrophages staining (CD68) based on 4 infiltration categories (nil, mild, moderate, and severe). b The Passing-Bablok regression between the averaged (averaged sTIL and itTIL) TIL and sTIL (r = 0.84). c The Passing-Bablok regression between the global TIL and itTIL (r = 0.37). d The Bland-Altman analysis of the CD3 score agreement between TMA and WS. e The Bland-Altman analysis for agreement between CD3 whole slide digital pathology and CD3 TMA digital pathology. f The Passing-Bablok between CD3 assessment by pathologists and digital pathology

