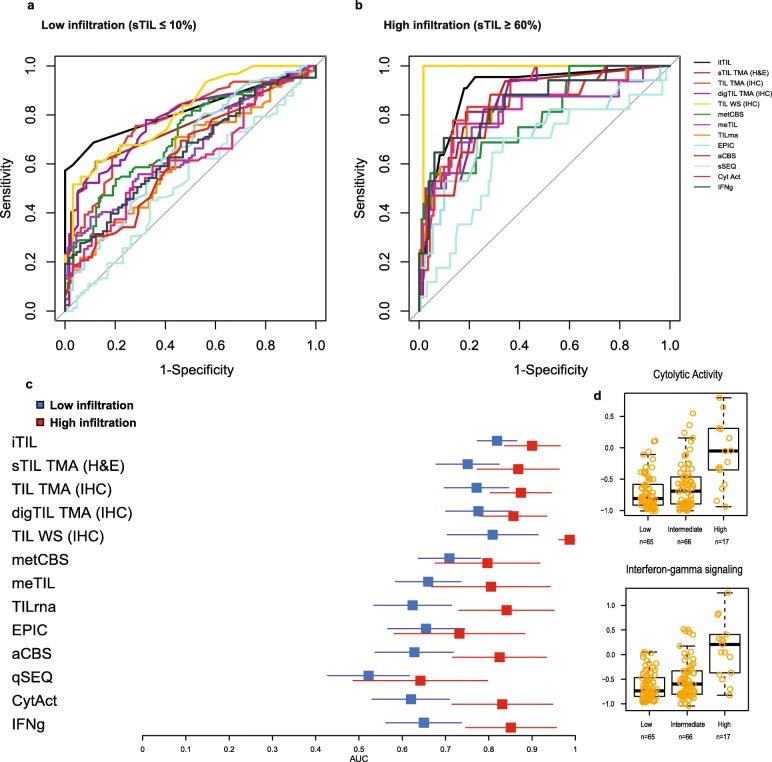
Fig. 4.
Identifying lowly and highly infiltrated tumors. The ROC curves for the different TIL methods a to classify lowly infiltrated tumors compared to the rest (blue color) and b to classify highly infiltrated tumors compared to rest (red color). The corresponding AUCs from a (blue color) and b (red color) are depicted in c. The distribution of TIL scores for the TIL methods and inflammatory signatures—cytolytic activity and interferon-gamma—is depicted in d for the low (≤ 10%), medium (11–59%), and high (≥ 60%) infiltrated tumors according to stromal TIL scores

