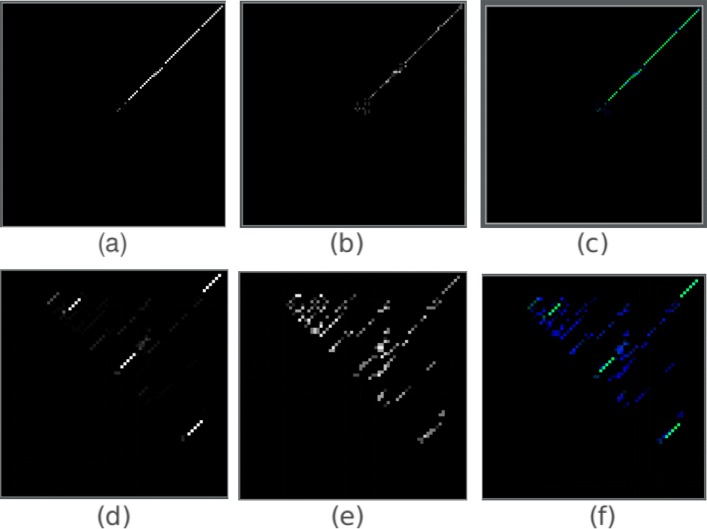
Fig. 2.
The probability, pair and mixed matrix images of miRNA and tRNA. (a), (b), (c) correspond to probability matrix, ordered pair matrix, mixed matrix of a miRNA sequence respectively. (d), (e), (f) correspond to probability matrix, ordered pair matrix, mixed matrix of a tRNA sequence respectively. For the mixed matrices, the color green is from the layer of probability matrix while blue represents the layer of the pair matrix

