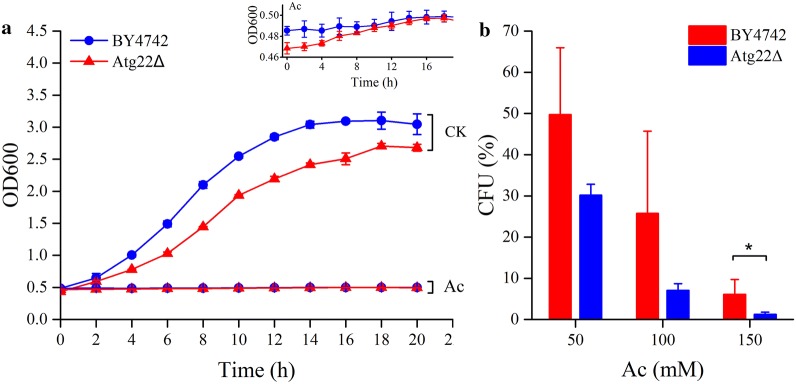
Fig. 1.
Growth curves of S. cerevisiae BY4742 and Atg22Δ (a), and cell survival of both strains after acetic acid treatment (b). The strains were cultured in SC media (pH 3.0) with acetic acid (Ac) or without 150 mM Ac (CK), and cultures at different times were assayed by optical density at 600 nm (OD600) (a). An enlarged image of growth curve during acetic acid treatment is illustrated in the insert. Viability of yeast cells treated with different concentration of acetic acid for 2 h were determined by assaying colony-forming units (CFU) after 3 days cultivation on YPD agar plates (b). The data represent mean ± SD (n = 3; *P < 0.05)

