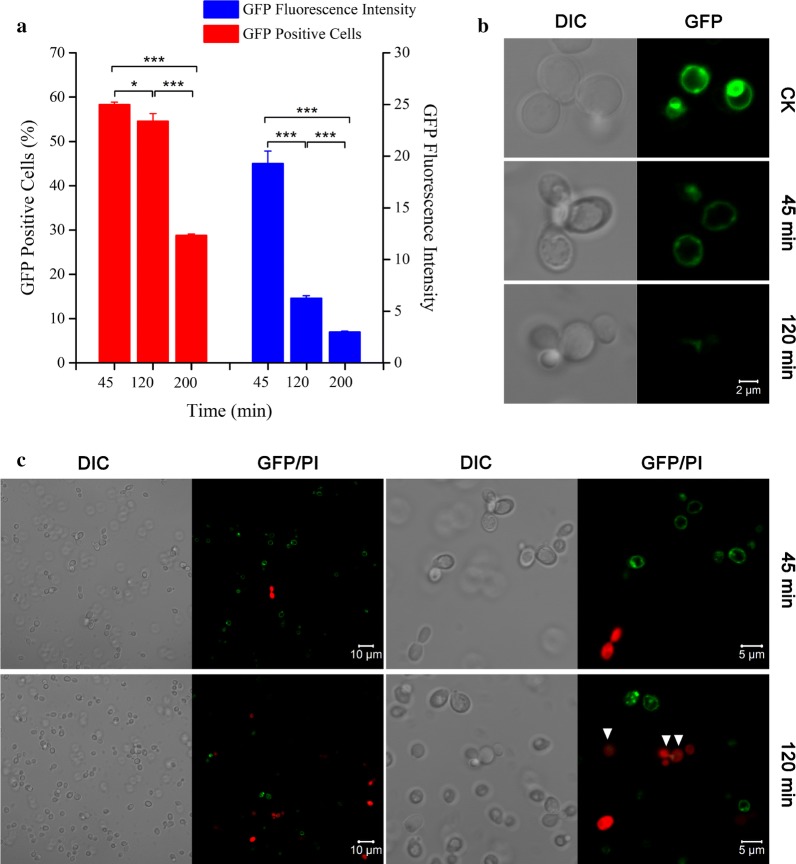
Fig. 4.
Quantification and visualization of Atg22p in yeast cells upon acetic acid stress. a Percentage of GFP-positive cells and mean fluorescence intensity were measured by flow cytometry in BY4742 cells harboring pTEF-Atg22-EGFP. b Representative images of differential interference contrast (DIC, left panels) and green fluorescence microscopy (GFP, right panels) were obtained from cells harboring pTEF-ATG22-EGFP before (CK) and after exposure to 150 mM acetic acid for 45 min and 120 min, respectively. c Representative DIC (first and third panels) and GFP/PI images (second and fourth panels) were obtained from cells harboring pTEF-ATG22-EGFP treated with 150 mM acetic acid for 45 min and 120 min, respectively. The GFP/PI images were merged with PI staining and GFP fluorescence, and GFP-positive cells with PI staining were indicated by white arrows. Data represent mean ± SD (n = 3; *P < 0.05, **P < 0.01, ***P < 0.001). In each experiment, 10,000 cells were evaluated by flow cytometry after incubation with 150 mM acetic acid for 45 min, 120 min and 200 min, respectively

