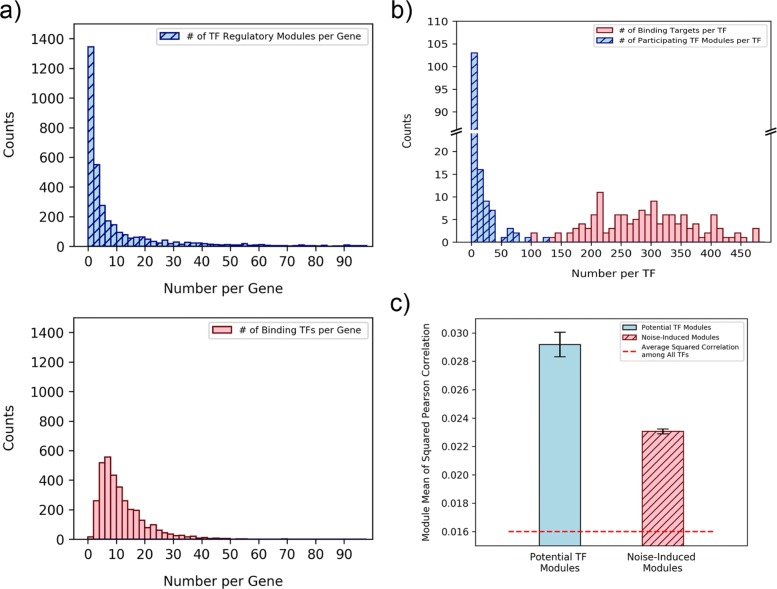
Fig. 2.
The histograms of the extracted TF regulatory modules per gene/TF and the module coherence comparison. a The average number of extracted TF regulatory modules per gene is smaller than the average number of binding TFs per gene. b The average number of participating TF regulatory modules per TF is also smaller than average the number of binding targets per TF. c The extracted potential TF regulatory modules showed higher coherence (average coherence = 0.029) than the coherence of the filtered-out noise-induced modules (average coherence = 0.023). The error bar in this plot indicates the standard error of the module coherence

