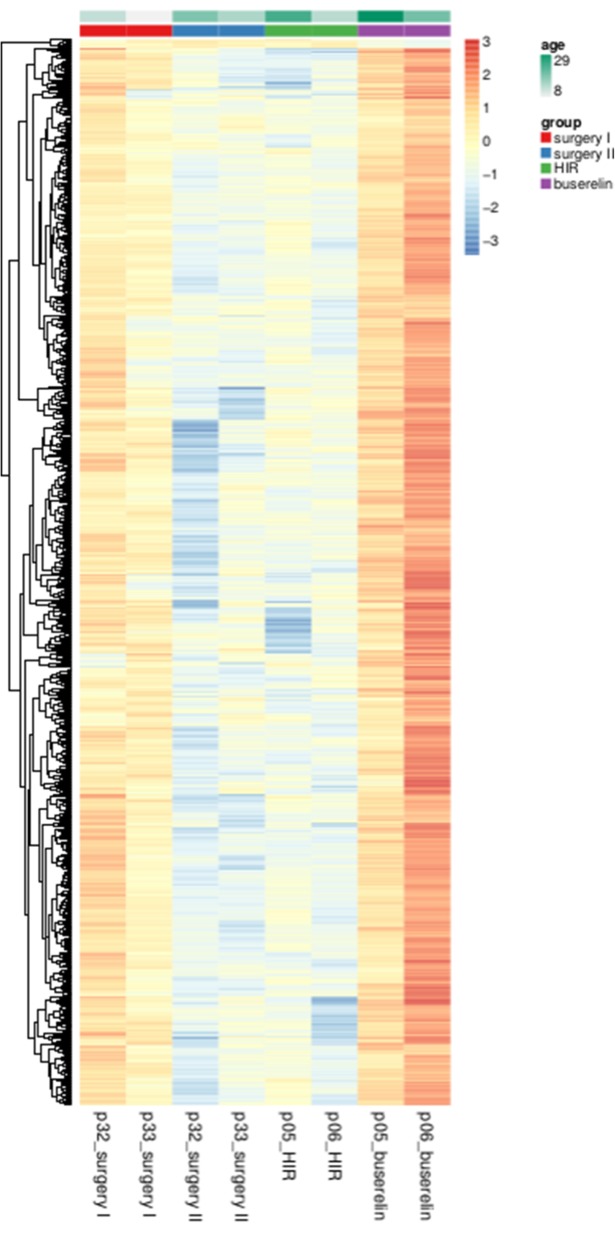
Fig. 2.
RNA-sequencing data for lncRNAs. A false color heatmap (red is high, blue is low) shows data from pairs of testes, analyzed. Horizontal bars at the top indicate patient categories and age. Four sample from two HIR patients (p32 and p33; biopsy number) having had surgery “only” treatment; line 1 and 2 during first surgery obtained from ipsilateral testis (I), line 3 and 4 show results from contralateral testis six months after first orchidopexy (II) Buserelin treated patients p5 and p6; line 5 an 6 before treatment and line 7 and 8 contralateral testis after hormonal treatment. Color scales for expression (red/blue) and age (green) are shown

