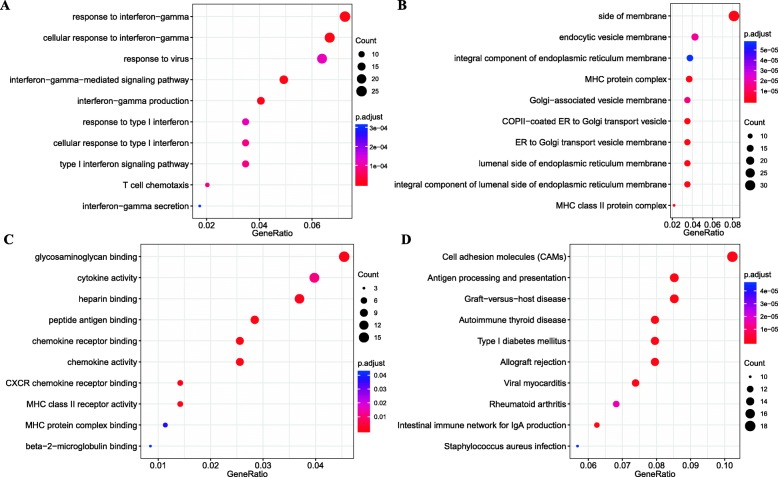
Fig. 3.
Functional enrichment analysis of 465 DEGs. (a) Enriched GO terms in the “biological process” category. (b) Enriched GO terms in the “cellular component” category. (c) Enriched GO terms in the “molecular function” category. (d) Enriched KEGG biological pathways. The x-axis represents the proportion of DEGs, and the y-axis represents different categories. The different colors indicate different properties, and the different sizes represent the number of DEGs

