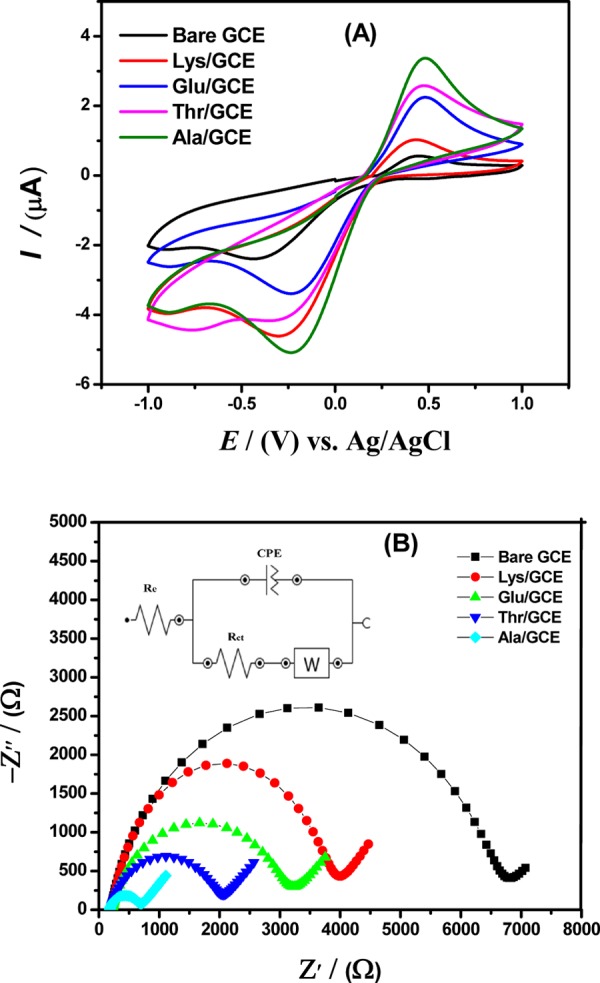
Figure 1.

Comparative (A) cyclic voltammograms obtained from bare GCE and alanine, threonine, glutamic acid, and lysine amino acid-modified GCE in a medium containing 5 mM K3[Fe(CN)6] solution and a 0.1 M KCl electrolyte. (B) Nyquist plots using electrochemical impedance spectroscopic data with applied frequency ranges varying from 100 kHz to 0.1 Hz. (Inset) Randles equivalent circuit model for the system under study showing resistors, capacitor, and Warburg impedance elements.
