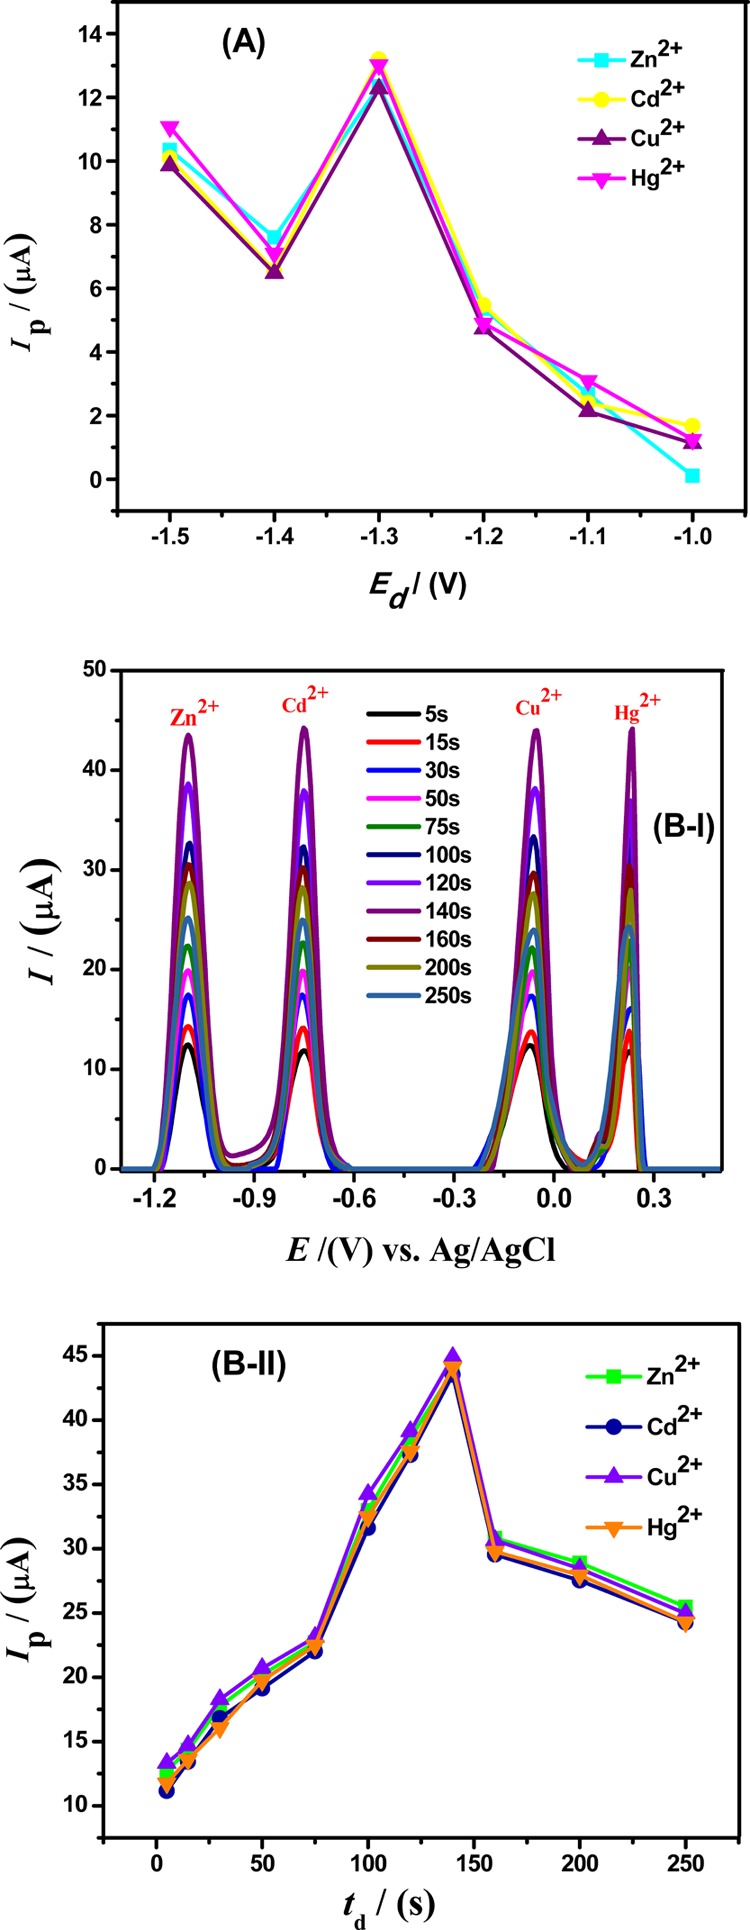
Figure 5.

(A) Plot of Ip vs Ed shows the influence of accumulation potentials on the oxidative peak currents of 100 μM Zn2+, 75 μM Cd2+, 50 μM Cu2+, and 75 μM Hg2+ ions in BRB of pH = 4, a scan rate of 100 mV/s, and a deposition time of 5 s at 65 μM Ala/GCE. (B-I) Effect of deposition times on the stripping current responses of 100 μM Zn2+, 75 μM Cd2+, 50 μM Cu2+, and 75 μM Hg2+ ions in BRB of pH = 4 with a deposition potential of −1.3 V, and a scan rate of 100 mV/s at 65 μM Ala/GCE. (B-II) Plot between Ip vs td at different deposition times in BRB of pH = 4
