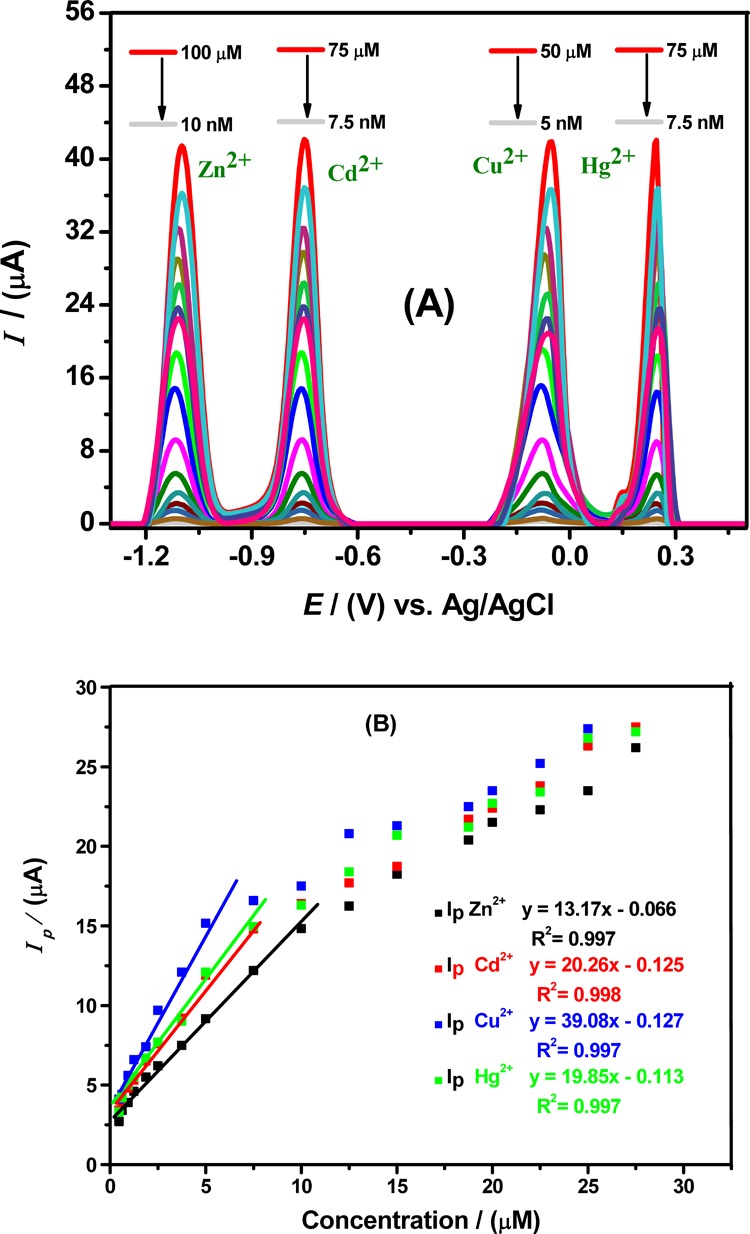
Figure 6.

(A) SWASV recorded at Ala/GCE by varying concentrations of Zn2+, Cd2+, Cu2+, and Hg2+ ions in BRB (pH = 4), a scan rate of 100 mV/s, a deposition potential of −1.3 V, and a deposition time of 140 s. The investigated concentration ranges are mentioned above each peak. (B) Corresponding calibration plots with linear equation and correlation values from data obtained from selected portion of plot-A SWASV showing linearity of Zn2+, Cd2+, Cu2+, and Hg2+ ion concentrations with Ip obtained under chosen optimized conditions for Ala/GCE for each metal ions
