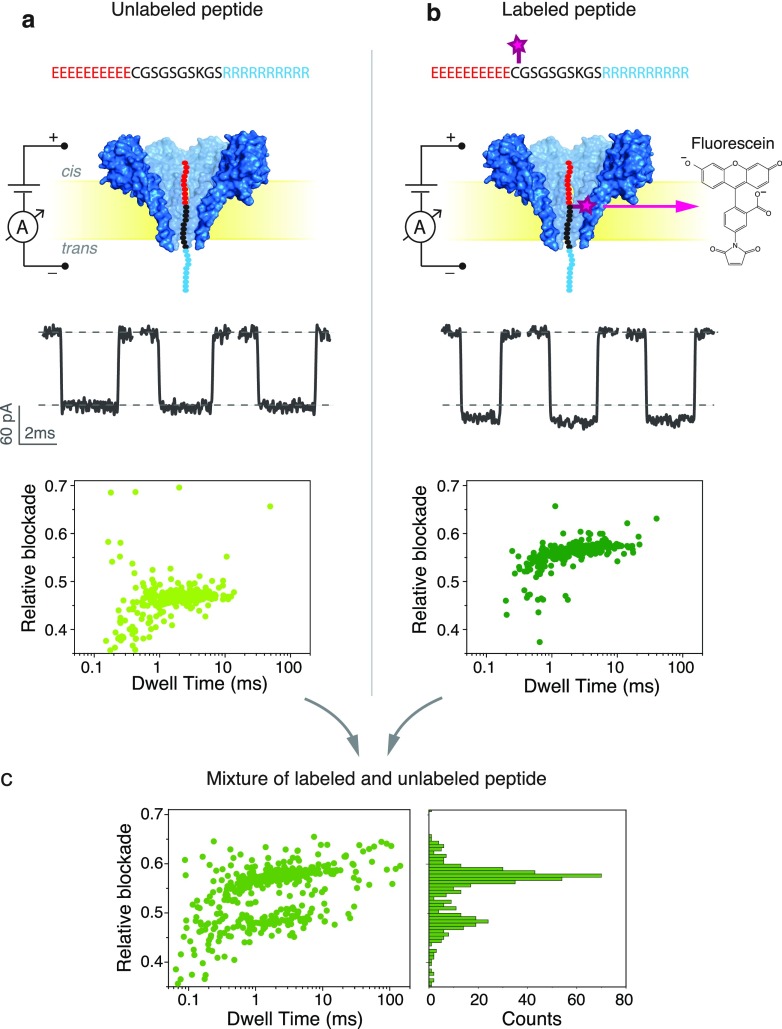
Figure 1.
Analysis of labeled and unlabeled peptides with FraC. From top to bottom: Schematic representation, typical events, and scatter plot of relative blockade vs dwell time of the unlabeled model peptide (a) and for the fluorescein-labeled model peptide (b) through the FraC nanopore. (c) Scatter plot of relative blockade vs dwell time (left) and relative blockade histogram (right) of a mixture containing labeled and unlabeled peptide. All measurements were done using a buffer containing 1 M NaCl, 10 mM Tris, and 1 mM EDTA at pH 7.5. The peptides were added to the cis compartment, and recordings were performed at a bias of −90 mV. Data were recorded at a sampling frequency of 500 kHz and further low-pass filtered at 10 kHz. FraC is shown as a surface representation from the PDB structure 4TSY.

