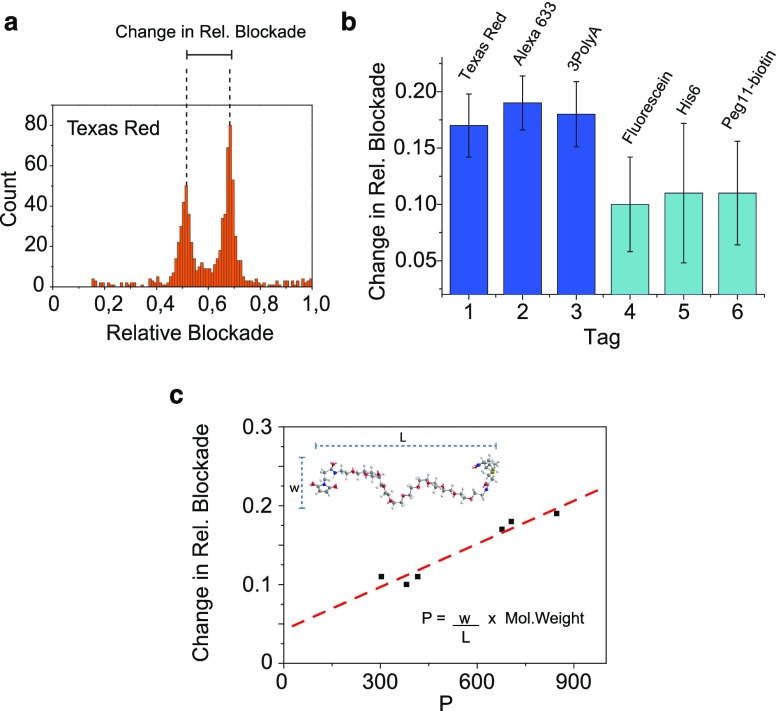
Figure 4.
(a) Relative blockade histogram for the mixture of unlabeled peptide and peptide labeled with Texas Red showing the change in relative blockade. (b) Shift in relative blockade measured for each label. Texas Red, Alexa633, and 3polyA cause a larger change in relative blockade. (c) Correlation between the change in relative blockade and parameter P = M × w/L, which characterizes the label’s geometry (see inset) and molecular weight (R2 = 0.92).

