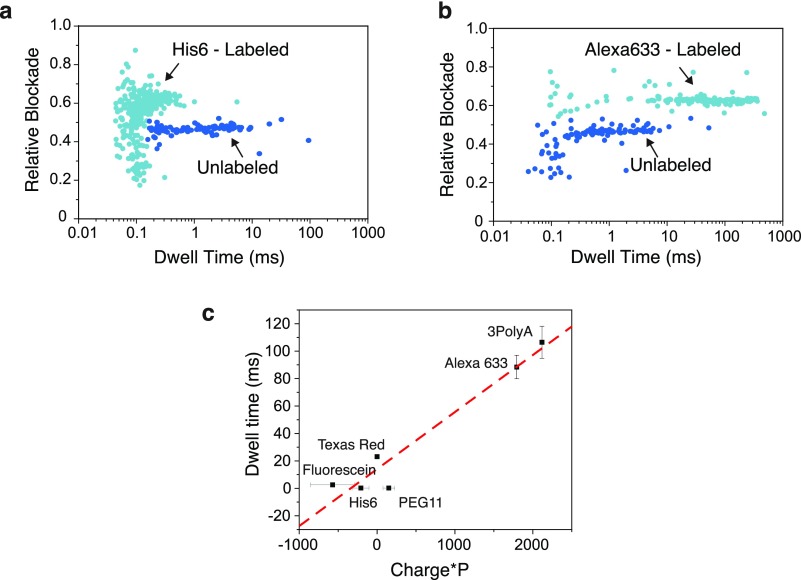
Figure 5.
Scatter plots of the peptide labeled with (a) His6 and (b) Alexa633. Faster translocation times are observed in peptides labeled with His6 compared to Alexa633. (c) Plot of dwell time vs net charge × P, where P = M × w/L (see Figure 4). A correlation (R2 = 0.93) is observed between these parameters. The errors in the x-axis for fluorescein, His6, and PEG11 represent the range of values that the parameter can take due to the possible charged states of the molecules.

