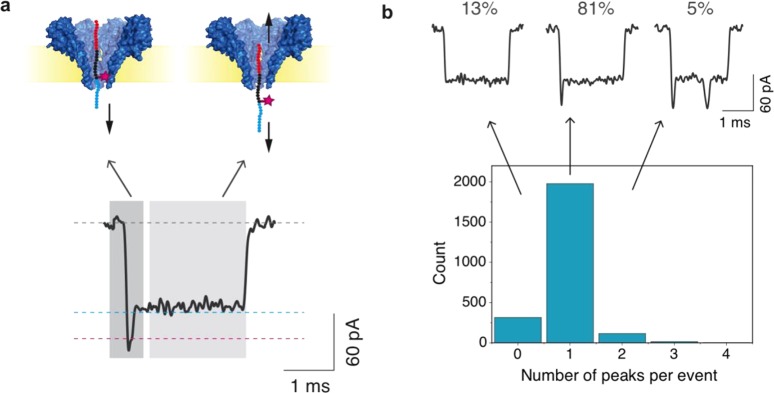
Figure 6.
(a) Typical event observed for fluorescein-labeled peptide in position 20C. A decrease in current is observed in the first fraction of the event as the labeled portion of the peptide moves through the FraC pore. (b) Histogram of the number of peaks observed per event. Data were recorded at −90 mV using a sampling frequency of 500 kHz. Event traces were low-pass filtered at 5 kHz.

