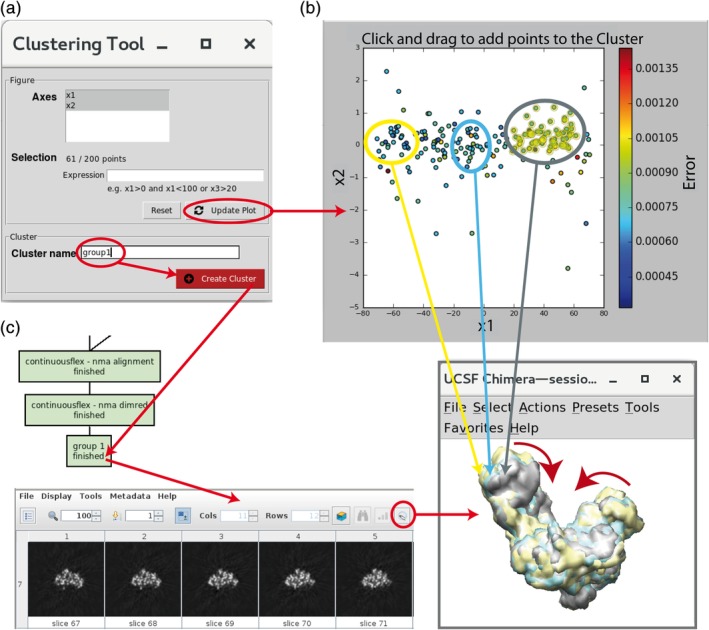
Figure 8.

3D reconstructions after image analysis. (a) Clustering Tool for grouping close points (images with similar conformations). (b) Example of selecting a group of points (circled in yellow) for 3D reconstruction. (c) Chimera superposition of three 3D reconstructions (yellow, cyan, and gray isosurfaces) from the corresponding groups of images denoted in panel b (points surrounded by yellow, cyan, and gray ellipses, panel b), with the most dominant motion shown by red arrows. The group of points saved using the “Create Cluster” button (panel a) appears as a new box in the project tree (panel c), possibly after using the “Refresh” button from the project window. The saved group of points can be inspected using the “Analyze Results” button from the project window, which shows images in this group (not shown here) and slices of the volume reconstructed from these images (panel c). The volume isosurface can be visualized by clicking on the Chimera icon in the slices display menu (panel c)
