
Figure 3.
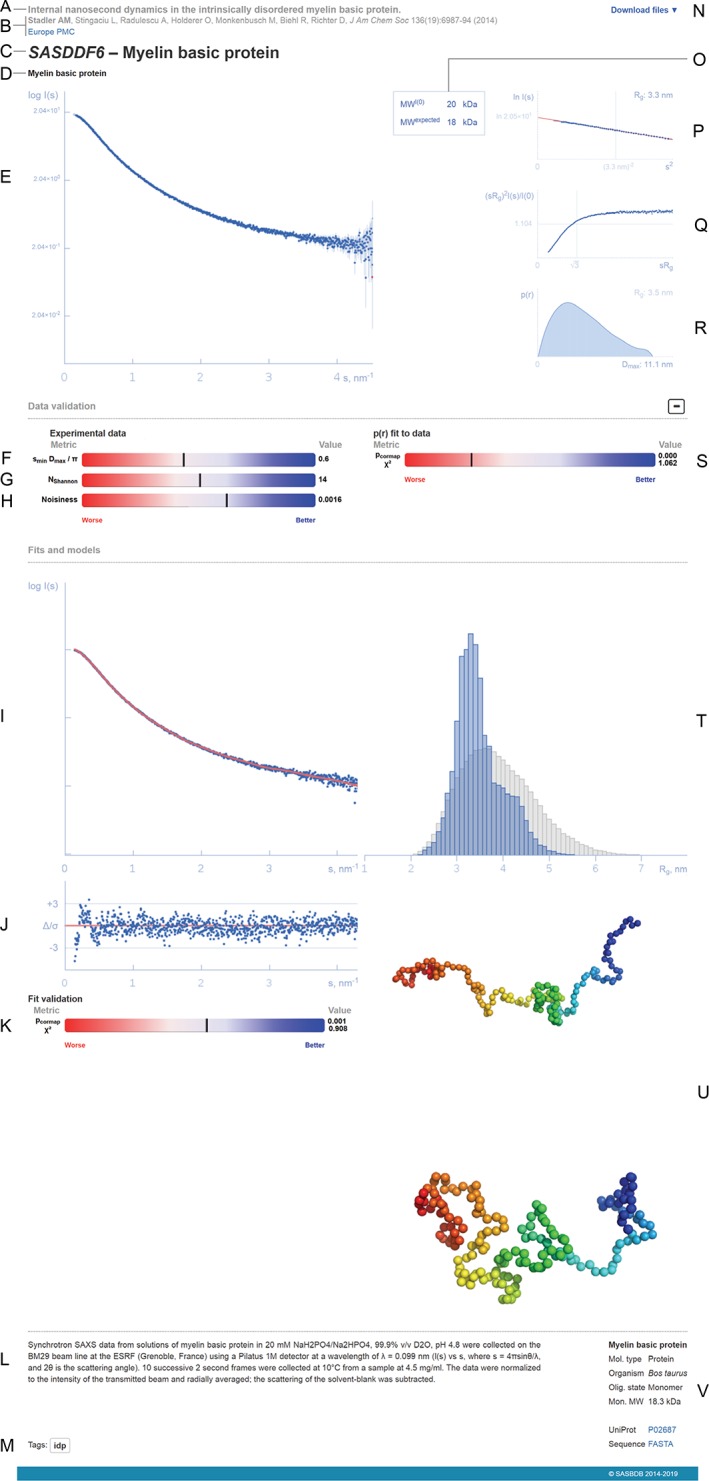
Representation of a SASBDB entry (based on https://www.sasbdb.org/data/SASDDF6/). (a) Title of the publication (or project in case of unpublished data). (b) List of authors (the main contributor is highlighted in bold), journal reference and a link to Europe PubMed Central. (c) SASBDB code and the title of the entry. (d) Names of the macromolecules that were measured. (e) Experimental scattering data (logarithmic plot). (f, g) Experimental data range percentile ranks. (h) Experimental noise percentile rank. (i) Fit to the experimental data. (j) Error‐weighted residual difference plot. (k) Goodness‐of‐fit percentile rank. (l) Experimental details. (m) Entry tag. (n) Drop‐down list of files available for download. (o) Comparison between experimental and expected molecular weights. (p) Guinier plot with the linear fit and the estimated values of the forward and scattering I(0) and the radius of gyration R g. (q) Dimensionless Kratky plot. (r) Pair distance distribution function p(r) and the maximum intraparticle distance Dmax. (s) p(r) goodness‐of‐fit to data percentile rank. (t) Histogram of the R g distribution of the generated pool (grey bars) compared to the final ensemble (blue bars), if present. (u) Associated models, for example, the most representative models from EOM ensemble. (v) Biological details of each measured macromolecule, FASTA sequence and link to UniProt