
Figure 4.
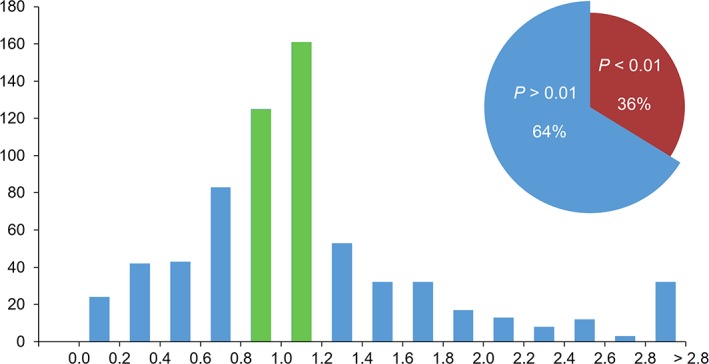
Histogram of χ2 distribution of p(r) fits with CorMap test p‐values >.01 (64% of all data sets). The green bars represent 42% of entries with expected 0.8 < χ 2 < 1.2. Inset: the ratio of acceptable p(r) fits (p‐values >.01, blue) and fits with systematic deviations (p‐values <.01, red) according to the CorMap test