
Figure 5.
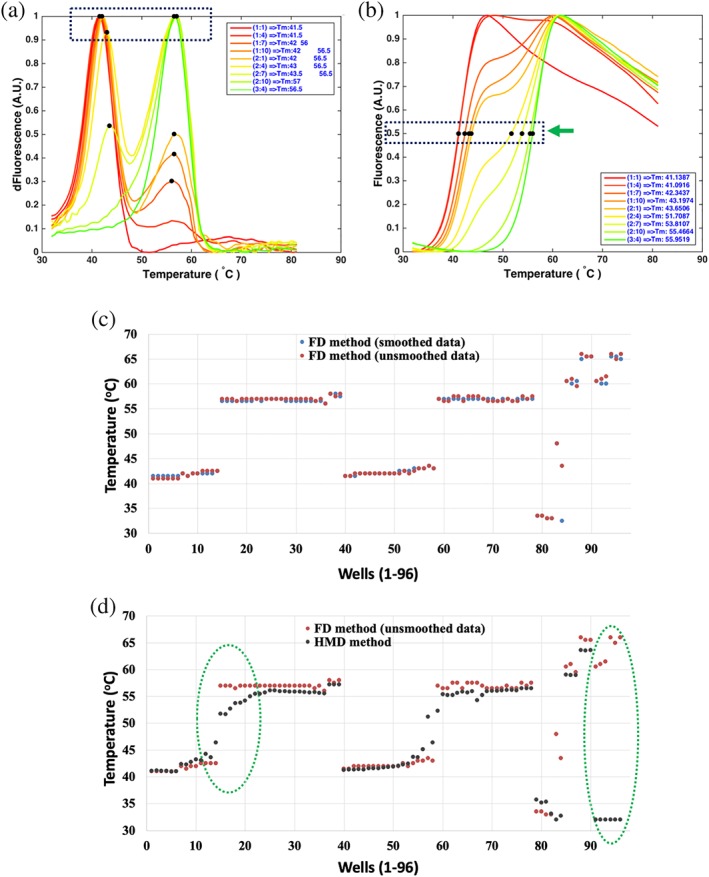
Calculation of Tm values. Two different methods are used to extract the Tm values, which are presented in figures a,b. The MCs or their first derivatives are from His‐FGF10 samples stabilized by a series of heparin ligands (concentrations are listed in Table 1). (a) The temperatures corresponding to the maxima of the FDCs are extracted as the Tm values, described as FD method. (b) The temperatures corresponding to half maximal fluorescence intensity are extracted as the Tm values, described as HMD method. (c) 96 Tm values of unsmoothed MCs and smoothed MCs were calculated using the FD method. (d) 96 Tm values of unsmoothed MCs were calculated using the FD method and HMD method. Green‐dotted circles indicate the regions of discrepancy between the two methods. The FD method is a more sensitive method for determination of curves with two Tm values (left green circle) or curves with strong starting fluorescence (right green circle)