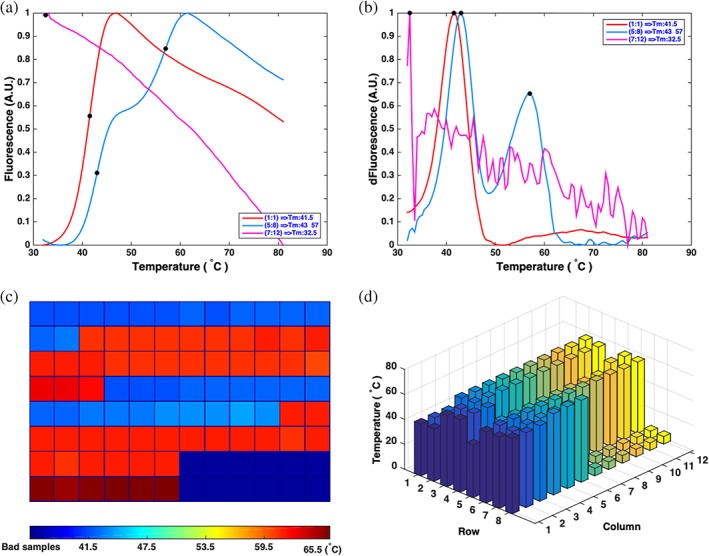
Figure 6.

Autoscreening the MCs and preview of Tm values in 96‐well plates. Three different types of MCs in (a) can be recognized by the program. The Tm information of 96 wells is automatically presented in two figures c,d. (a) MCs of His‐FGF10 (red line), His‐FGF10 stabilized with 0.625 μM heparin (blue line), and His‐FGF10 (pink line) denatured by 8 M urea. (b) FDCs calculated from MCs in (a). (c) 2D map view of Tm values of the proteins in 96 wells. The dark blue wells contain unfolded proteins or unstable proteins (e.g., proteins in an inappropriate buffer). The color bar displays the Tm range. (d) 3D view of Tm values. The Tm of each well is plotted with a bar in the 3D graph with same color for each column
