
Figure 5.
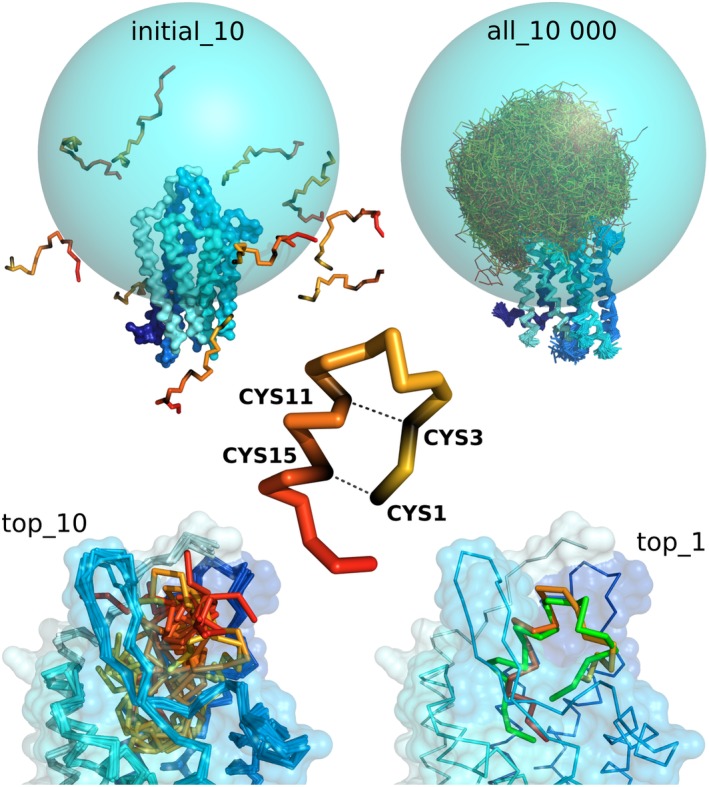
Main stages of CABS‐dock docking procedure used in prediction of an example peptide–GPCR complex. The figure shows the case of endothelin ETB receptor–peptide complex (PDB ID: 5GLH 31). The sampling of a peptide conformational space was limited to the sphere (marked in blue) covering the binding site and extracellular fragments of the GPCR. The sampling was limited using long‐distance restraints (of length 30 Å) between C‐alpha atom of a single GPCR residue (residue number 249) and all C‐alpha atoms of the docked peptide. Additionally, distance restraints were put within the peptide structure to enforce disulfide bridges (cysteine residues number 1–15 and 3–11). In the bottom, the figure shows 10 top‐scored models and first top‐scored model superimposed on the experimental structure shown in green (RMSD value: 3.25 Å). The command to run the presented simulation in CABS‐dock standalone is provided in the last section: Examples of CABS‐dock standalone commands