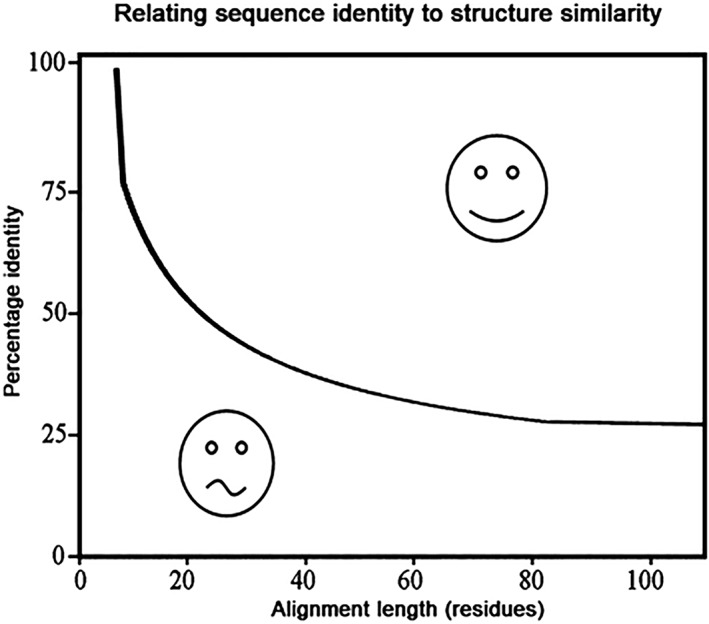
Figure 4.

Homology modeling threshold curve. This plot describes which minimum percentage sequence identity in an alignment of a given length is an indication that the aligned proteins have similar structures. This is frequently used in the context of homology modeling: alignments above the curve indicate that it is possible to make a fairly reliable homology model from the aligned template; alignments below the curve mean that a homology model should be handled with care. We also use this plot for the inclusion of sequences in HSSP alignments
