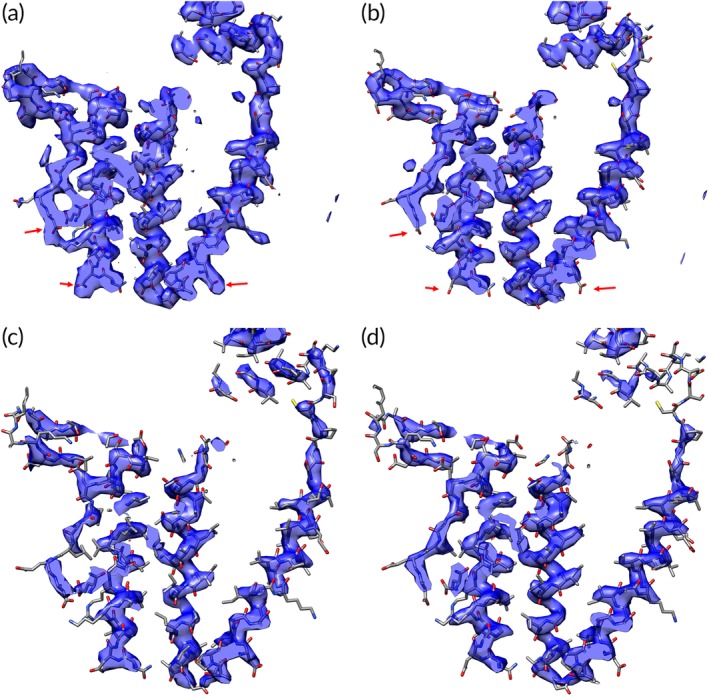
Figure 1.

Experimental X‐ray and cryo‐EM maps of groEL. (a) Experimental X‐ray map (MIR phasing, density modified) at resolution of 3.8 Å of groEL showing residues 10–170 (masked around atoms in these residues). (b) Experimental cryo‐EM map at resolution of 3.5 Å of groEL showing residues 10–170 (masked around atoms in these residues). (c) X‐ray map of groEL from (a), but at higher contour level. (d) Cryo‐EM map of groEL from (b), but at higher contour level. The arrows indicate locations of aspartate and glutamate side chains where the density appears to be substantially different between the X‐ray and cryo‐EM maps
