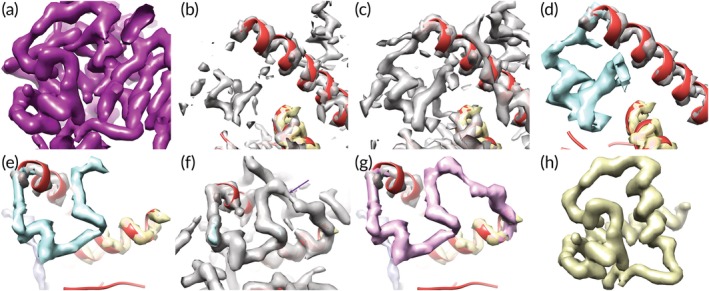
Figure 2.

Automatic analysis of density in a map of rotavirus VP6 protein. (a) Box of density cut out from a rotavirus VP6 structure at a resolution of 2.6 Å.29 Contours are at an arbitrary level adjusted to maximize continuity of chain (tubes of density) and minimize connections between different parts of the chain. (b) Helical fragments identified in the map shown in (a) (different view) and map density at a high contour level. (c) View as in panel B, but density at a lower contour level showing connections to the helical fragments. (d) Interpretation of density in panel C, where density of one color (e.g., blue) corresponds to points that are connected at a particular contour level and not already part of a previously‐identified region (e.g., the gray density). (e), (f), and (g) Connecting segments of density by gradually decreasing contour level. Panel (e) shows a set of segments (grey, blue, yellow) identified in previous steps. Panel (f) shows density in the map at a slightly lower contour level that just connects the blue and yellow segments. Panel (g) shows the automatic reinterpretation of the blue and connecting density as a single purple segment. (h) Density representing one isolated chain obtained from the map shown in panel (a) using the automatic procedure described here (see text)
