Figure 5.

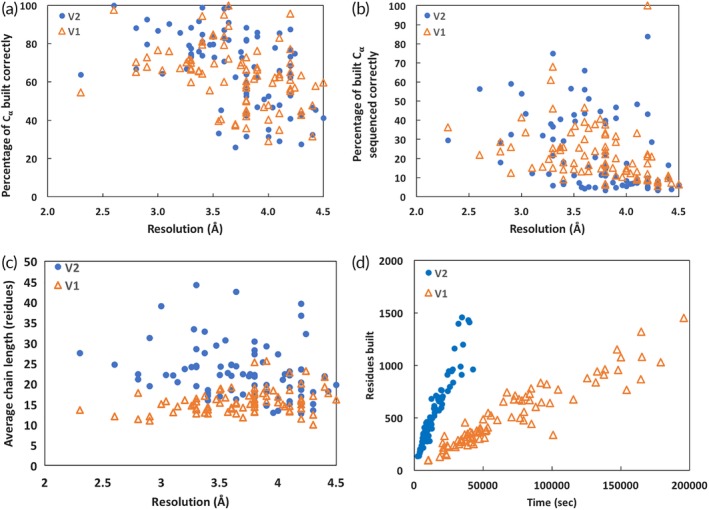
Application of phenix.map_to_model procedure to deposited maps and comparison with deposited models. (a) Percentage of Cα atoms in each of 88 deposited structures matched within 3 Å by a Cα atom in an automatically‐built structure (see text for details). (b) Percentage of side chains for each of 88 automatically‐built models matching the amino acid in the corresponding deposited structure (see text for details). (c) Mean chain length (length of segments between breaks in the chain) for each of 88 automatically‐built models. (d) Time required and number of residues built for automatic model‐building. Triangles are for phenix.map_to_model version 1 and filled circles are version 2
