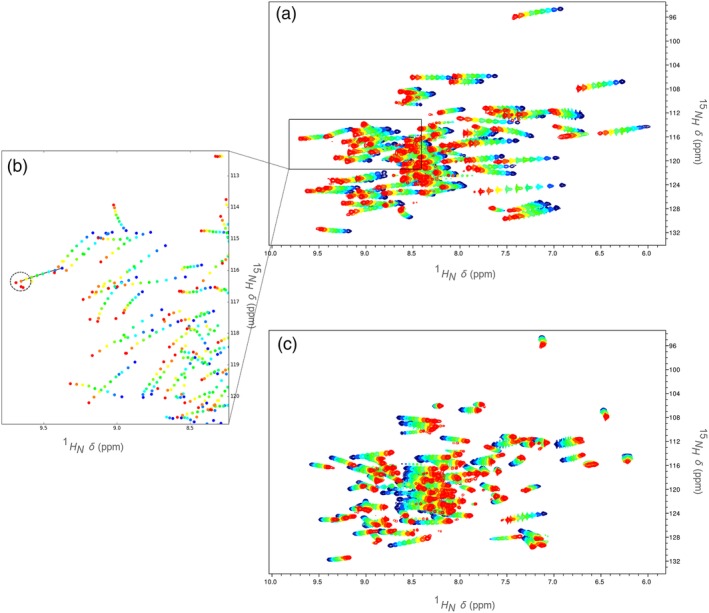
Figure 2.

An example of overlaid 1H—15N data from HSQC spectra collected over a range of temperatures (blue: low; red: high). (a) unreferenced HSQC spectra; the deuterium lock artefact is evident. (b) peaks picked from the indicated region of the 1H—15N plane—line segments join peaks in a ShiftTrack candidate line, and the search radius for the final point is indicated by the dashed circle (peaks are tracked in unreferenced spectra in order to take advantage of deuterium lock artefact‐induced regularity). (c) HSQC spectra referenced to DSS, showing the true temperature dependences of amide chemical shifts
