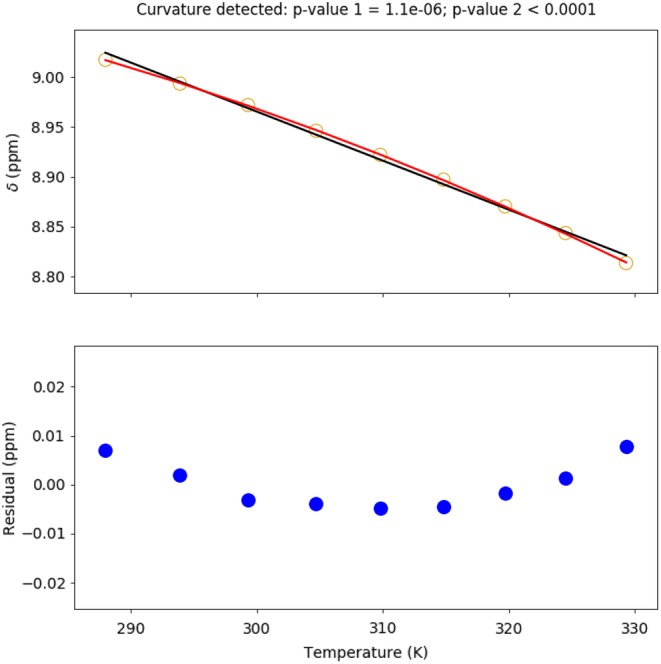
Figure 3.

Chemical shifts (referenced to DSS; open circles, top) and residuals (filled circles, bottom) illustrating both temperature coefficient calculation (slope of black line) and curvature detection (red quadratic). The probability that the linear model is correct (from the extra sum of squares F test) is reported as p value 1. The probability that the curvature observed is the result of random errors (from numerical simulation of residual errors) is reported as p value 2
