Figure 2.

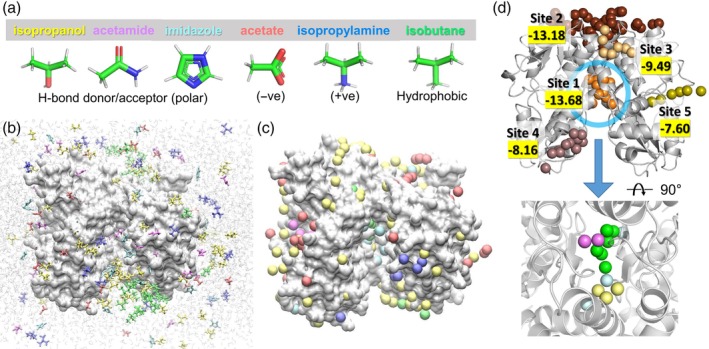
Druggability simulations. (a) The ensemble of probe molecules used in the current study. Six types of probes (isopropanol [yellow], acetamide [magenta], imidazole [cyan], acetate [red], isopropylamine [blue], and isobutane [green]) were used, and their structures and features are indicated at the bottom. (b) A snapshot of the simulated system. An LBD dimer of AMPAR subtype GluA2 is shown in silver surface representation and probe molecules are shown as sticks colored by types. Water molecules are shown as shaded light gray lines in the background. (c) Hot spots from the druggability analysis. Hot spots are voxels in 3D space, which are highly occupied by probe molecules. Clusters of hot spots form druggable sites. Hot spots are obtained for each probe molecule type and are displayed as balls in the same color as the probe. (d) Druggable sites revealed by clusters of hot stops. There are five such sites shown in different colors. They are ranked by score (highlighted in yellow; comparable to binding energy in kcal/mol) with Site 1 having the highest affinity. Site 1 (blue ellipse) is known to bind allosteric modulators that potentiate ion channel currents by blocking desensitization. At the bottom, the zoom‐in view of Site 1 (rotated to show all the hot spots clearly) is shown. We observe hot spots for isopropanol, acetamide, imidazole, and isobutane at Site 1. There are no hot spots for acetate and isopropylamine. AMPAR, AMPA receptor; LBD, ligand‐binding domain
