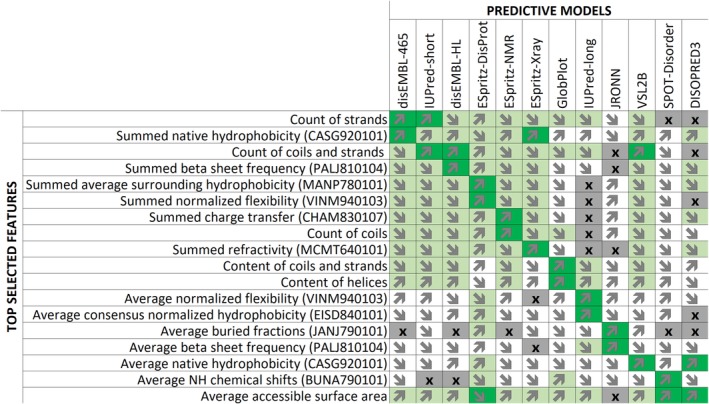
Figure 3.

Key features used in the 12 models. The performance of individual features is quantified with the Pearson correlation coefficients (PCC) between feature values (rows) and the actual area under the receiver operating characteristic curve (AUC) for each model (columns) that were quantified on the training data set. Detailed explanation of features is available in the Table S1. PCC values are color‐coded where dark green is for |PCC| ≥ 0.3, light green for |PCC| between 0.15 and 0.30, white for |PCC| < 0.15, and gray with “x” symbol indicate the a given feature is not included in the model for that predictor. The direction of arrows reveals the sign of PCC where upwards arrows denote positive correlation while downward arrows denote negative correlation
