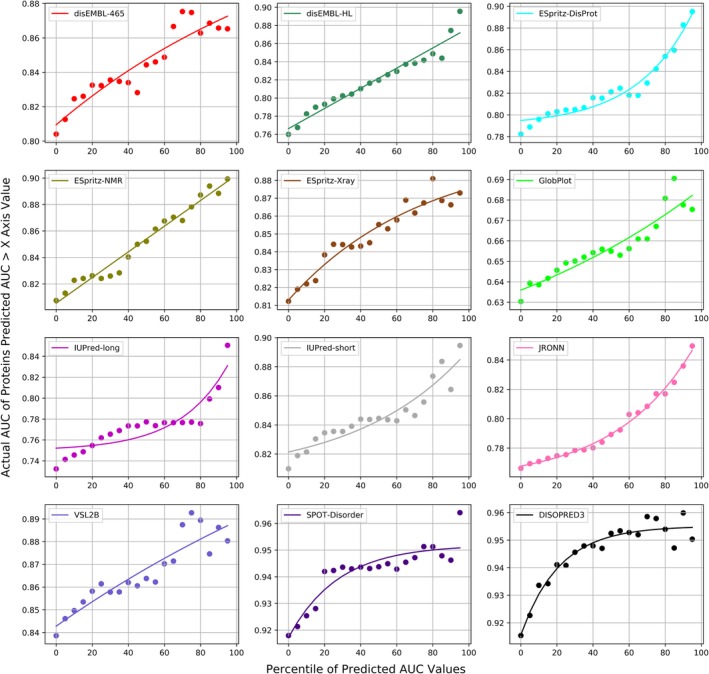
Figure 4.

The data set‐level actual area under the receiver operating characteristic curve (AUC) values for subsets of the test proteins that are sorted based on their AUCs values estimated by DISOselect. Individual panels correspond to different disorder predictors. Points in each panel correspond to AUCs of the subsets of test proteins for which the estimated AUCs are above a given percentile of all estimated AUCs, that is, the 20 mark on the x‐axis corresponds to the 80% of the test proteins that have estimated AUCs that are above the 20th percentile of estimated AUCs generated by DISOselect. The left‐most point corresponds to the result on the complete test data set while the right‐most point corresponds to the 5% of test proteins with the highest estimated AUCs. The line is the third‐degree polynomial fit into the measured data
