
Figure 3.
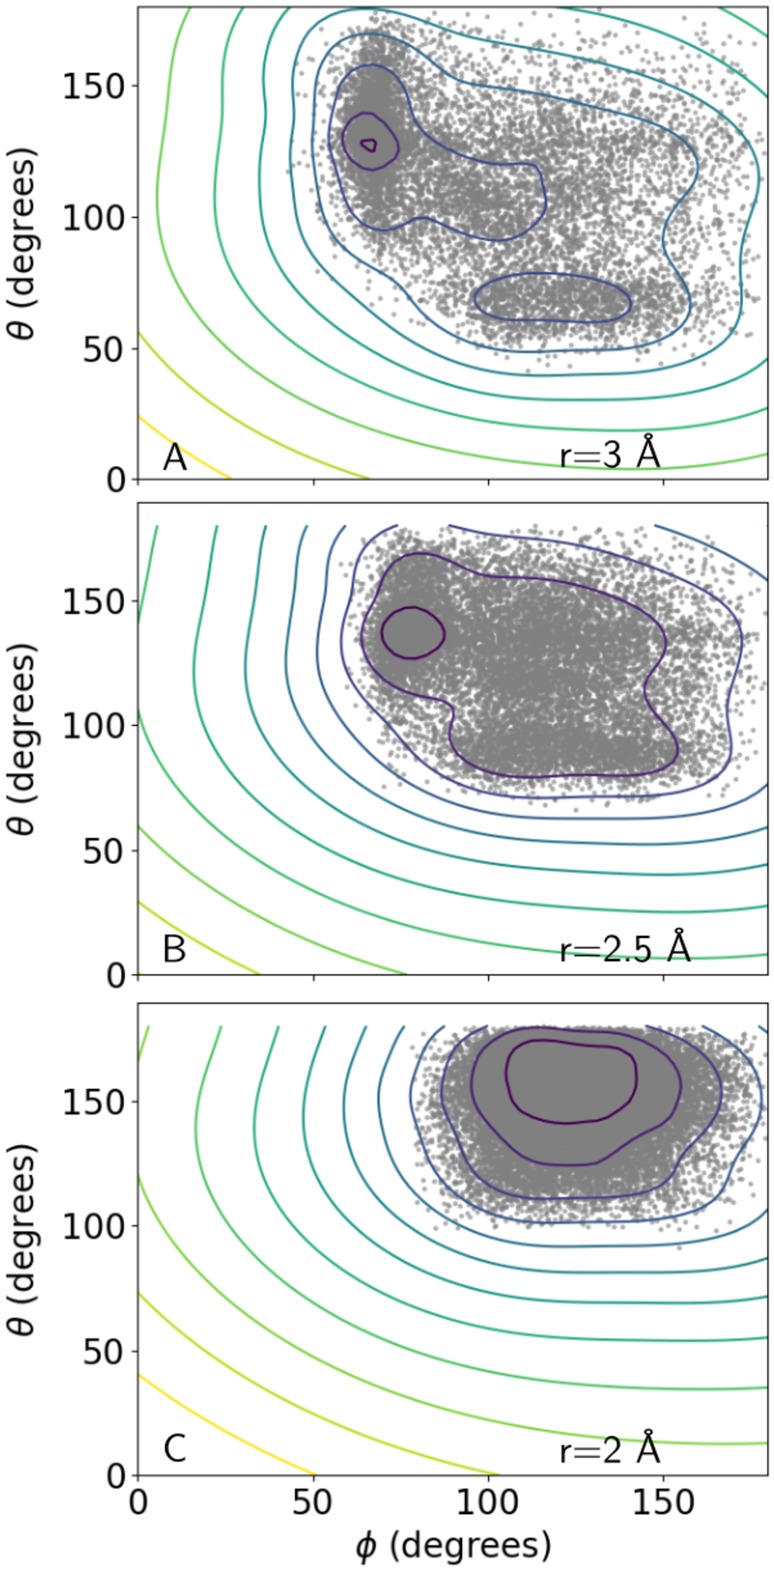
Panels (a)–(c) depict isosurfaces of 2D cross‐sections of the Class VI HBPot energy surface (involving glutamine and asparagine sidechain oxygens) at three values of r. Each gray dot corresponds to an input data point from the Top8000 database within the indicated value of r ± 0.1 Å. Contours are drawn at energy intervals of 0.1, with the maximum contour plotted for an energy of 0.2, such that the minimum energy contours are drawn for values of −0.7, −0.7, and −0.9 in (a), (b), and (c), respectively