
Figure 10.
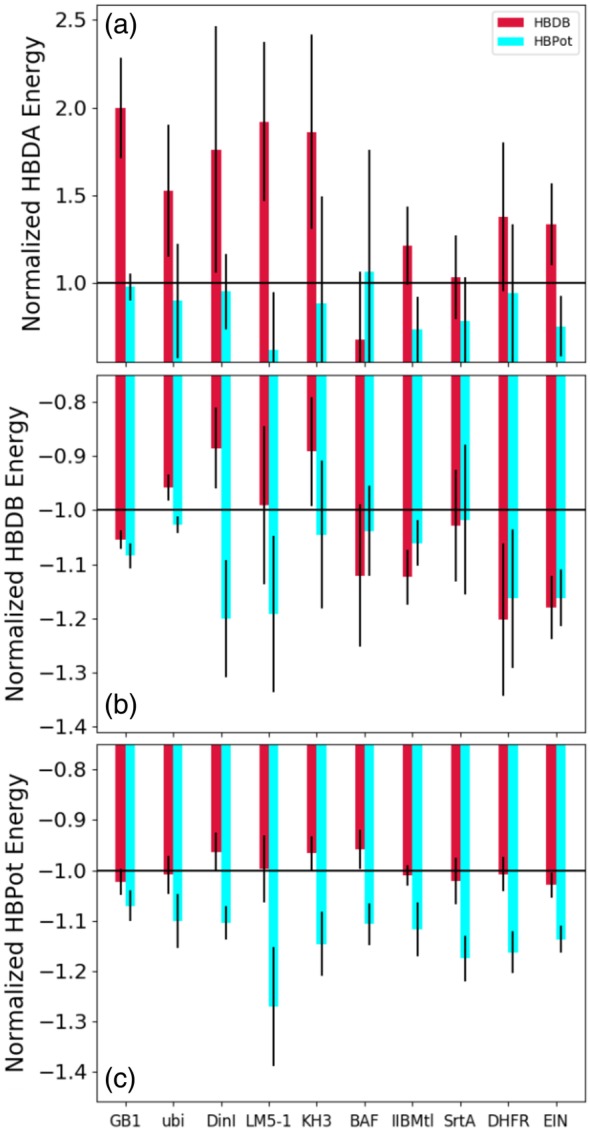
Hydrogen bond energies report the efficacy of the hydrogen bond energy terms. Panels (a), (b), and (c) report the HBDB, HBPot, and HBDA energy terms for the 10 protein example cases with either the HBDB or HBPot energy term, normalized by the energy corresponding to the calculations with no explicit hydrogen bonding energy. In each panel a horizontal line indicates signed unity, the normalized energy corresponding to using no hydrogen bonding term. Because a smaller (more negative or less positive) value indicates a better fit to the potential of mean force or (in the case of HBDA) empirical formula, bars below/above the line represent better/worse fits for the depicted energy term. For each bar, deviations in energy between the lowest 20 calculated structures are denoted by the thin black error bars