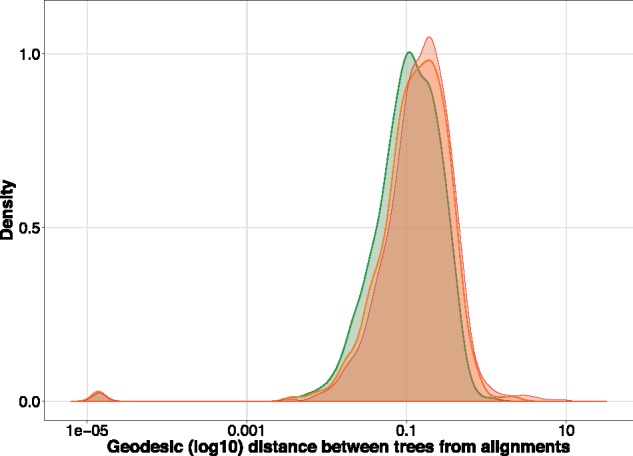
Fig. 5.

Geodesic distance between tree estimates from MAFFT and PRANK MSAs on a bird phylogenomic data set. The red curve represents trees estimated from the raw MSAs, the orange curve trees from MSAs filtered by Zorro and the green curve trees estimated from divvied MSAs. Note for clarity the curve for partial filtering is not shown since it is indistinguishable from that produced from divvying.
