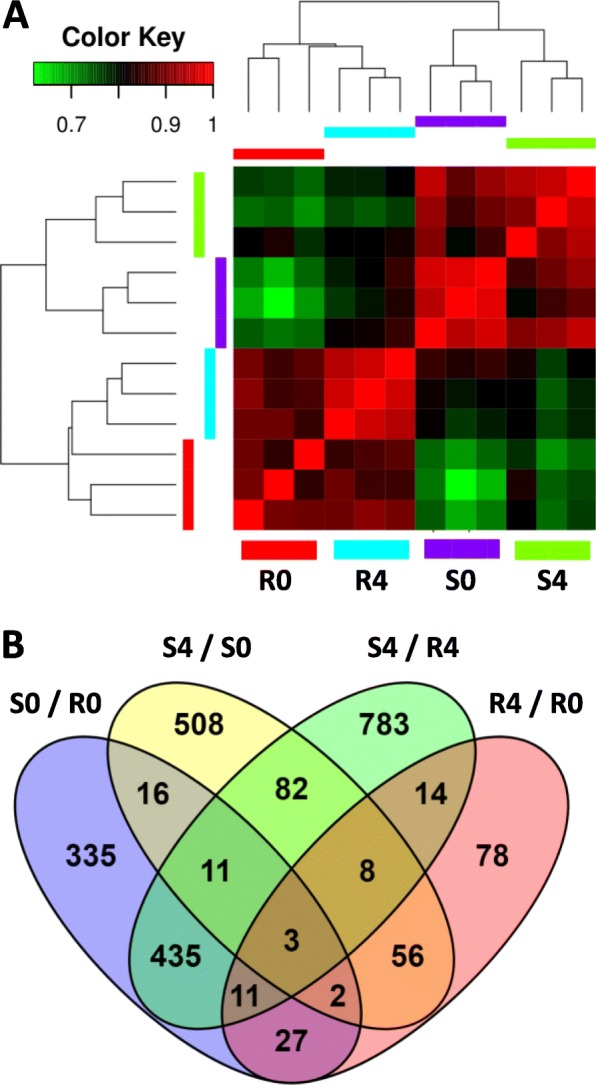
Fig. 1.

Similarity and overlaps in differentially expressed genes among experimental treatments. Four treatments were analyzed each in three replicates: Resistant at day 0 (R0) and day 4 (R4) and Susceptible at day 0 (S0) and day 4 (S4). a Similarity among replicates and treatments is shown by a heat map of correlation coefficients between normalized read counts of differentially expressed genes (DEGs). b Number of DEGs identified in each of four pairwise comparisons (S0/R0, S4/S0, S4/R4 and R4/R0) and the overlaps among these DEG lists
