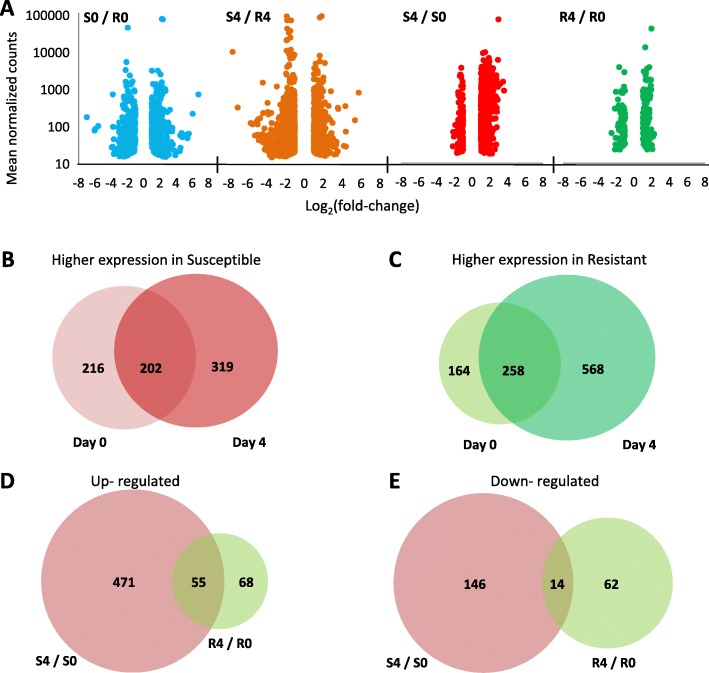
Fig. 2.
Volcano plots of DEGs and overlaps in DEGs in response to infection. a Volcano plots showing the distribution of normalized read counts as a function of Log2(fold-change) for DEGs in each of the four comparisons. Negative and positive Log2(fold-change) describe down-regulated and up-regulated genes, respectively, relative to the reference treatment, which is always the denominator of the title (e.g for S0/R0, R0 is the reference). b and c Overlap in number of genes more highly expressed at days 0 and 4 (b) in susceptible compared to resistant fish and c in resistant compared to susceptible fish. d and e Overlap in number of genes between the response to infection of resistant (R4/R0) and susceptible (S4/S0) fish divided to (d) up-regulated and (e) down-regulated DEGs

