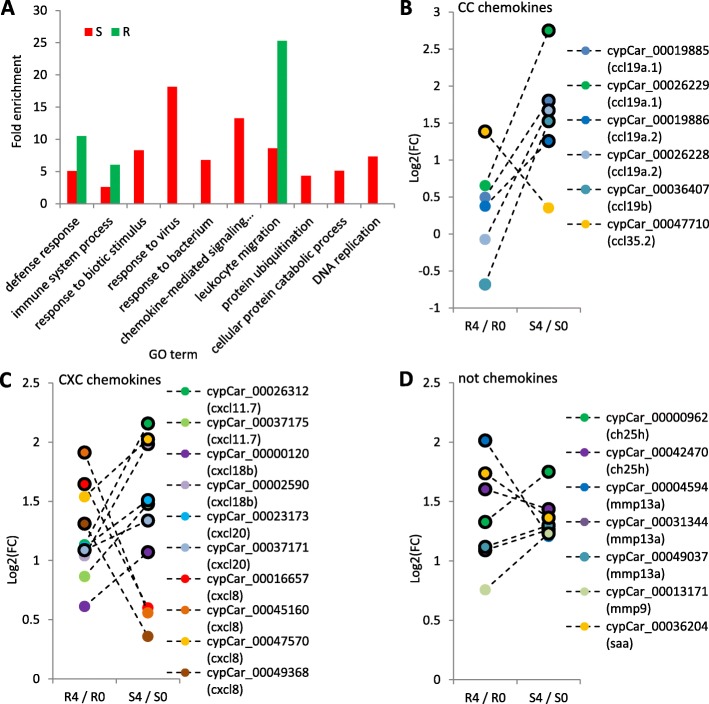
Fig. 3.
Enriched GO terms and expression levels of DEGs from enriched terms. a Fold enrichment of GO terms significantly enriched for up-regulated genes in response to infection (day4/day0) in susceptible (red bars) and resistant (green bars) fish. b-d Log2(fold-change) between days 4 and 0 of carp genes from the enriched ‘leukocyte migration’ GO term. Genes are marked by different colors and cypCar IDs (unique identifier of a gene module in the common carp genome). Gene name based on ZF annotation is given in parentheses. Different cypCars with the same gene name, represent different carp copies with highest homology to the same ZF gene. Dashed lines connect the differences in expression levels [Log2(FC)] of each gene in response to infection in resistant (R4/R0) and susceptible (S4/S0) fish. Genes that were found to be DEGs between days 4 and 0 are marked by black-outlined dots. Note that a value of 0 means no change, a value of 1 means 2-fold change and larger than 1, a higher fold change. Such comparisons were done for different gene families: (b) CC chemokines, (c) CXC chemokines and (d) non-chemokine genes included in this GO term

