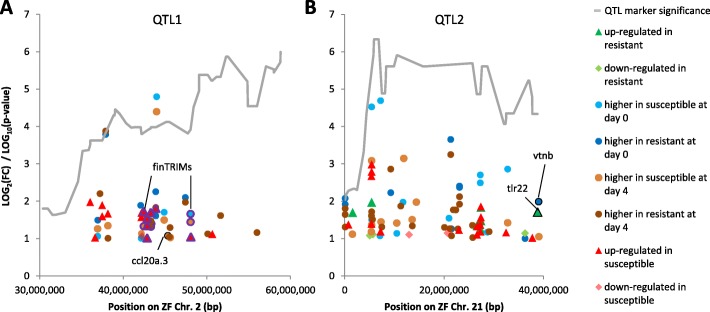
Fig. 5.
Location and expression of DEGs within previously identified CyHV-3 survival QTLs. Log2(fold-change) for DEGs is plotted against their orthologous location in the ZF genome. Plots are shown for (a) QTL1 (ZF chromosome 2) and (b) QTL 2 (ZF chromosome 21). DEGs location is displayed in the context of the QTL shape (grey line) as deduced from the significance level [Log10(p-value)] of the association test between markers and survival. Marker position in the ZF genome and their test significance were adapted from [35]. DEG symbols were labeled by shape and color according to the comparison in which they were found significant and their direction (up or down-regulated for S0/S4 and R0/R4 comparisons or higher in susceptible or resistant for S0/R0 or S4/R4 comparisons). DEGs with a functional annotation related to immune response have black outlined symbols and gene names attached. Because there were many fin-TRIM genes clustered in QTL1, their name is given only once but their symbols are purple outlined

