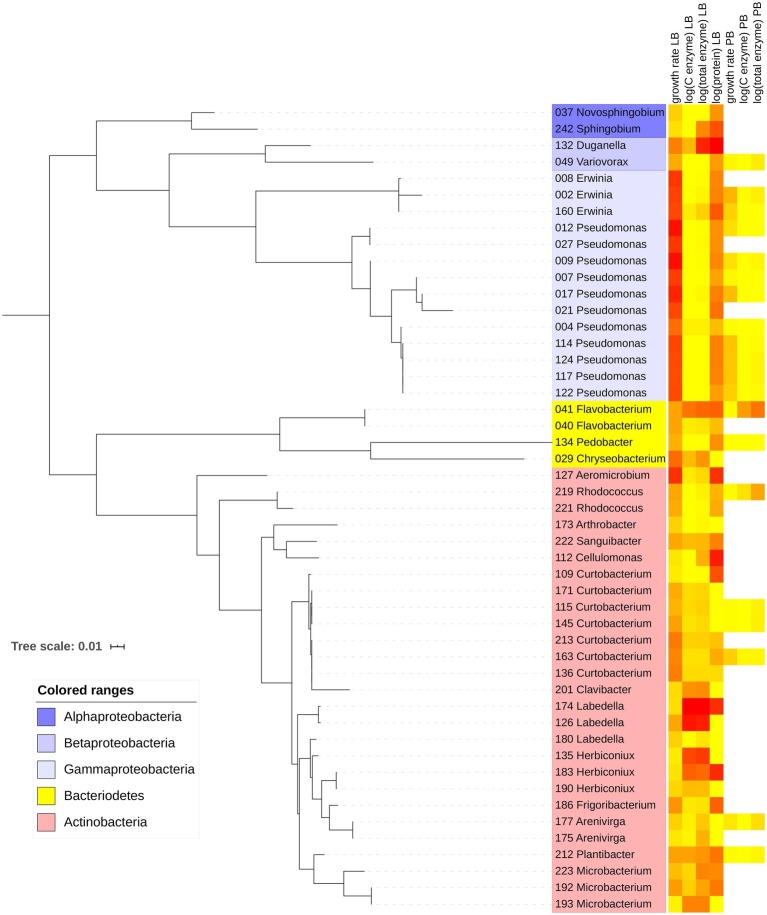
Figure 1.
Maximum-likelihood phylogenetic tree with 49 bacterial strains included in the study. Leaves show strain number and likely genus based on GenBank matches. Heatmap indicates relative magnitudes of growth rate, enzyme, and protein traits in Luria broth (LB) and plant litter broth (PB). Yellow corresponds to the minimum value, and red corresponds to the maximum value within each trait.

