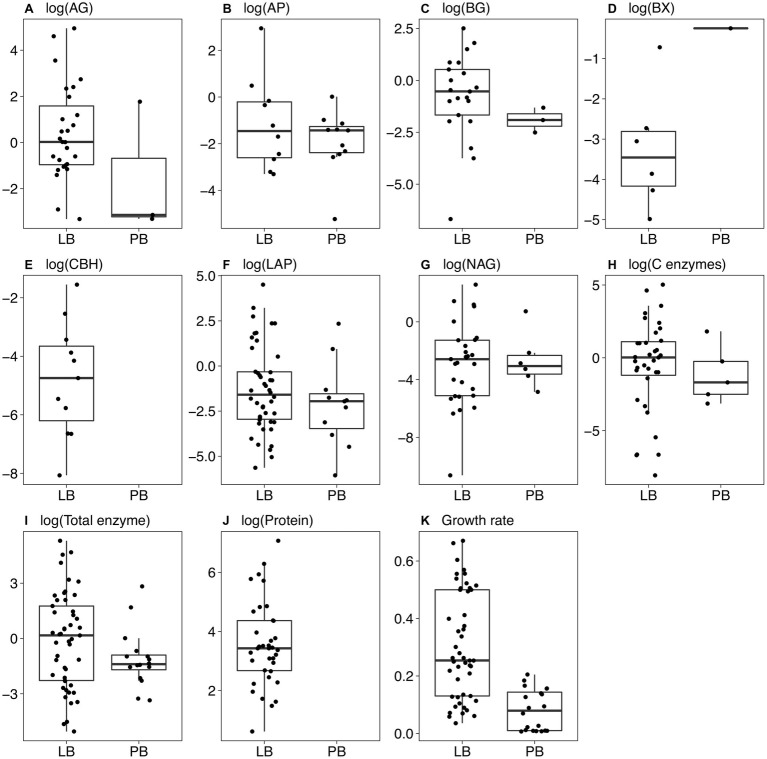
Figure 2.
Boxplots of trait values for bacterial strains growing on Luria broth (LB) and plant litter broth (PB). Only non-zero values are shown. (A) α-glucosidase; (B) acid phosphatase; (C) β-glucosidase; (D) β-xylosidase; (E) cellobiohydrolase; (F) leucine aminopeptidase; (G) N-acetyl-glucosaminidase; (H) the sum of AG, BG, BX, and CBH; (I) the sum of all enzyme activities; (J) protein level in the culture supernatant; (K) maximum growth rate (h−1). Boxes indicate the median and first and third quartiles. Whiskers indicate the data range, not including outlying points. (A) through (I) show (log+1)-transformed units of nmol mg−1 biomass h−1, and (J) shows (log+1)-transformed units of μg protein mg−1 biomass.

