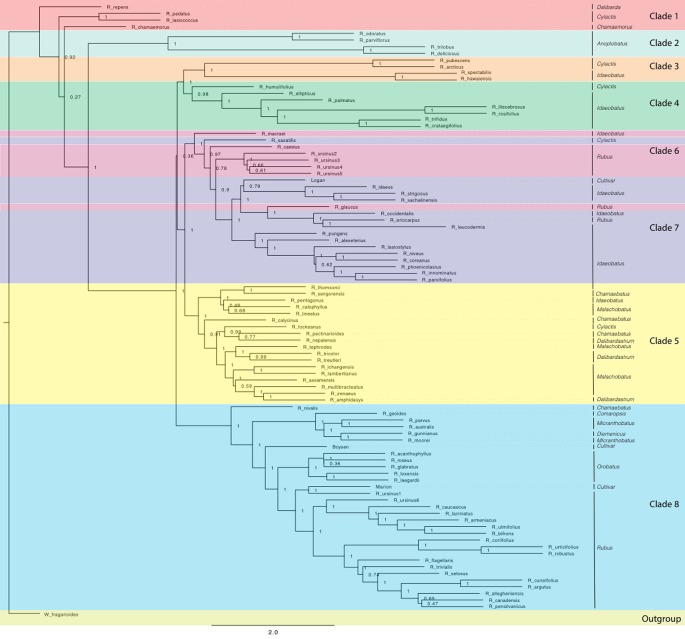
Figure 2.
ASTRAL-II phylogeny estimated from exon sequence gene trees from all Rubus taxa. Posterior probability values (0–1) are shown to the right of each node. Branch lengths are in coalescent units and measure discordance in the underlying gene trees. Groups are labelled with colored bands. Taxa are labelled with their subgeneric classification.

