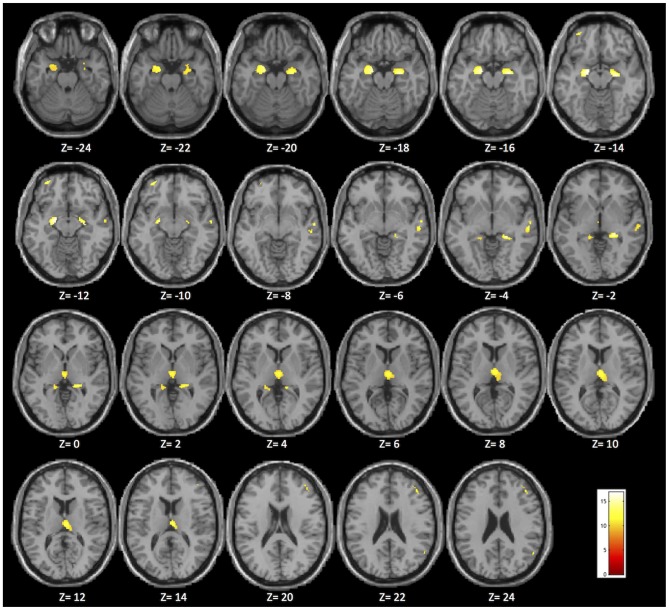
Figure 1.
Brain areas in which significant differences were found among the MCIε4+/+, MCIε4+/−, MCIε4−/−, and control groups in the whole-brain voxel-based morphometry (VBM) analysis (p < 0.05 family-wise error (FWE) correction for multiple comparisons in the whole brain). The significant regions are superimposed on a standard template, with Montreal Neurological Institute (MNI) coordinates indicated at the bottom of each slice.

