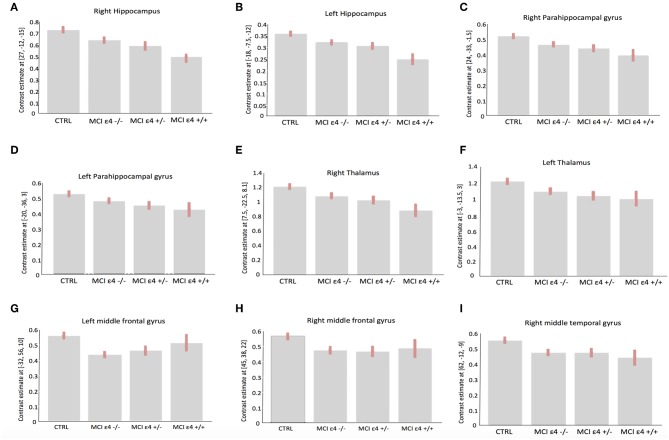
Figure 2.
Plots depicting mean differences among groups within region of statistical significance in VBM analysis: right (A) and left (B) hippocampus; right (C) and left (D) parahippocampal gyrus; right (E) and left (F) thalamus, left (G) and right (H) middle frontal gyrus, and right middle temporal gyrus (I).

