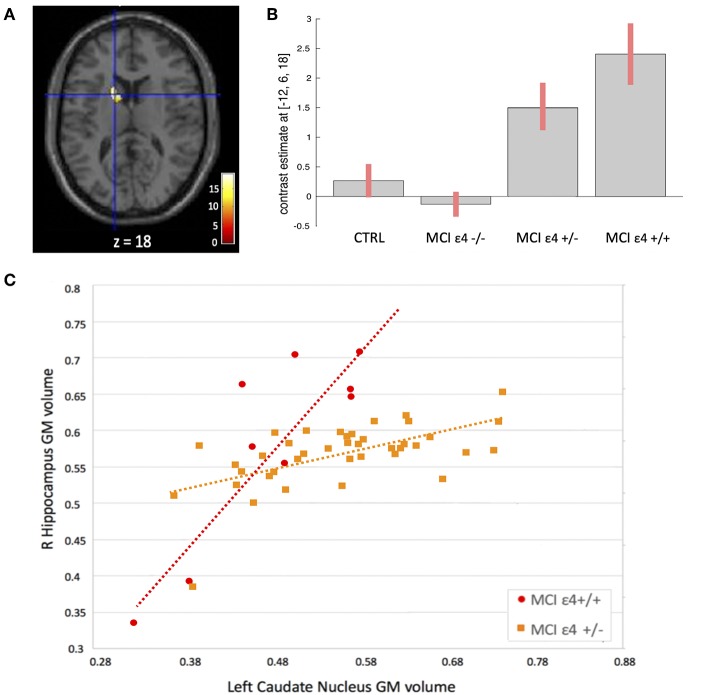
Figure 3.
(A) Voxels that expressed the difference in structural association between the right hippocampus and the left caudate nucleus among the groups. (B) Plots depicting mean differences among the groups within region of statistical significance in structural covariance analysis. (C) Correlations between gray matter (GM) volumes extracted from 4-mm radius sphere centered on the ROI and the peak voxel expressing increased structural association in the MCIε4+/+ and in MCIε4+/− groups.

