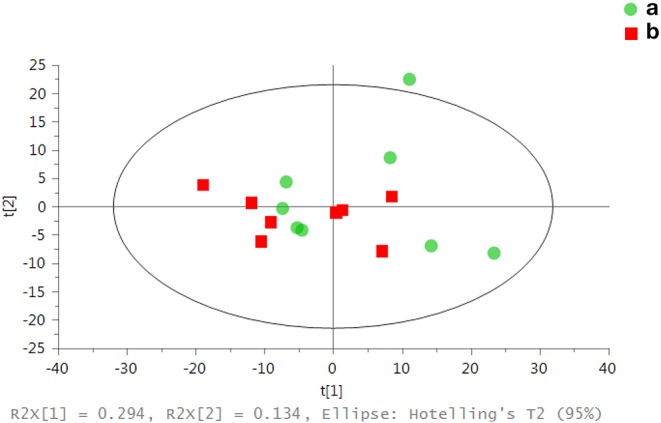
Figure 4.

Assessment of metabolic differences in renal samples from both groups by PCA scores: each point in the figure represents the overall metabolic profile of a serum sample. (a) represents the renal cortex of the control group. (b) represents the renal cortex of the LPS 2 h group.
