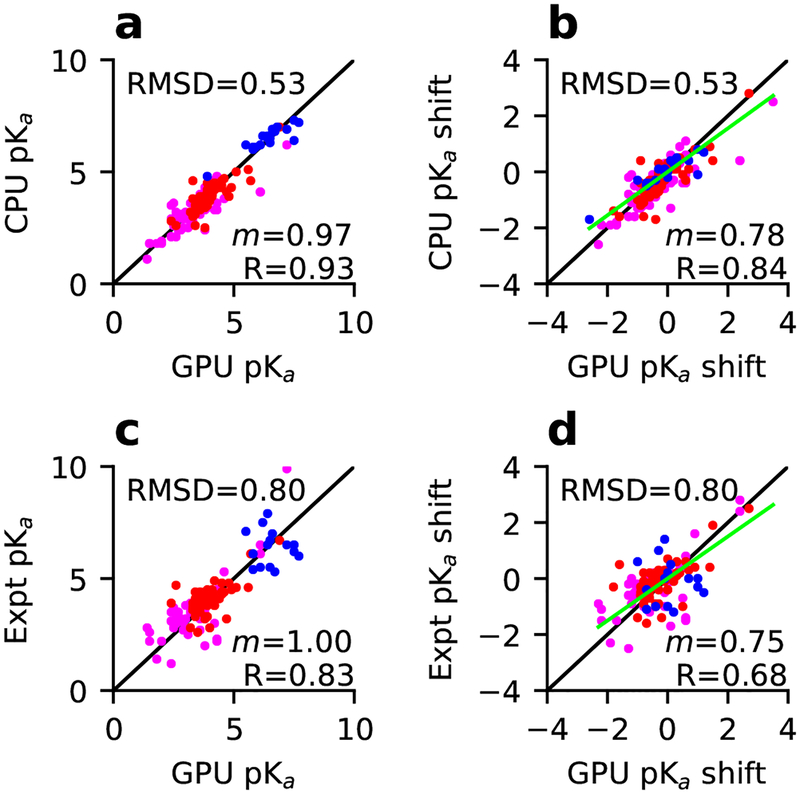
Figure 3: Comparison of the pKa’s and pKa shifts from the GPU single-pH simulations to the CPU replica-exchange simulations or experiment.
The GPU pKa estimates compared to (a) CPU and (b) experiment and the corresponding plots ((c) and (d)) for the pKa shifts. The model pKa’s from Thurlkill et al.41 were used for calculating the shifts. Data for Asp, Glu, and His resides are colored magenta, dark red, and blue, respectively. The diagonal (y = x) and linear regression lines are colored black and green, respectively. RMSD, regression slope (m) and Pearson’s correlation coefficient (R) are shown. The regression was performed with a zero intercept (R only changed in the second decimal point). In c and d, only pKa’s with NMR determined pKa’s are included. In d, the data for Asp26 in thioredoxin are hidden for clarity (the experimental pKa shift > 4).

