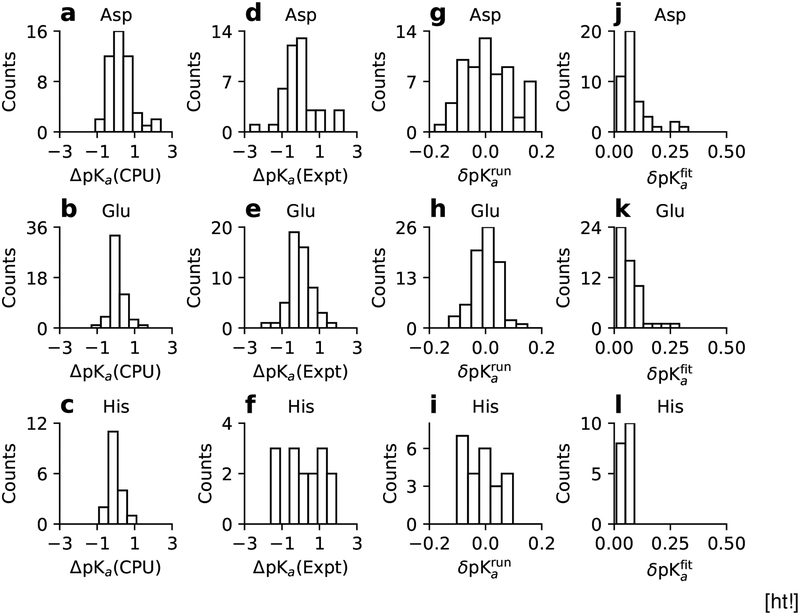
Figure 4:
(a-c) Comparisons of the Asp, Glu, and His pKa’s from the GPU single-pH and CPU replica-exchange simulations(ΔpKa(CPU) = GPU pKa−CPU pKa). (d-f) Comparisons of the single-pH results and experiment (ΔpKa(Expt) = GPU pKa−Expt pKa). (g-i) Histograms of the convergence error estimates (δpKarun) obtained from the difference between the 2-ns and 1.5-ns pKa’s. Asp26 of Thioredoxin (δpKarun =−0.34) falls off the plot. (j-l) Histograms of the statistical error estimates from the pKa fitting. The linked residues, Asp19/Asp21 in SNase and Asp10/Asp79 in RNase H, are excluded in the error estimates.

