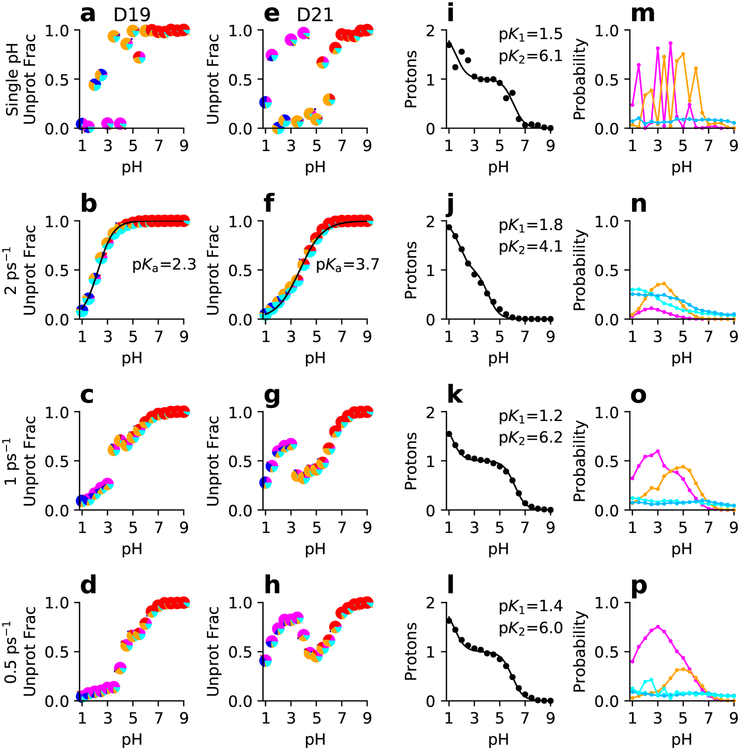
Figure 5: Titration data of the linked residues D19 and D21 in SNase from single-pH and replica-exchange simulations.
From top to bottom rows, single-pH and replica-exchange simulations with different exchange attempt frequencies are shown. (a-h) Unprotonated fraction as a function of pH and best fit to the residue-specific HH equation for D19 (a-d) and D21 (e-h). Each data point is a pie chart showing the probability of the four protonation states: D19H/D21H (blue), D19−/D21− (red), D19H/D21− (magenta), and D19(−)/D21H (orange). Cyan indicates that one of the residues is in a mixed state. (i-l) Total number of protons as a function of pH and best fit to the linked-titration model. (m-p) Probabilities of the singly-protonated (magenta for D19H/D21− and orange for D19−/D21H) and mixed states (light cyan for D19 titration and dark cyan for D21 titration) as functions of pH. The macroscopic experimental pKa’s are 2.2 and 6.5 for D19 and D21, respectively.

