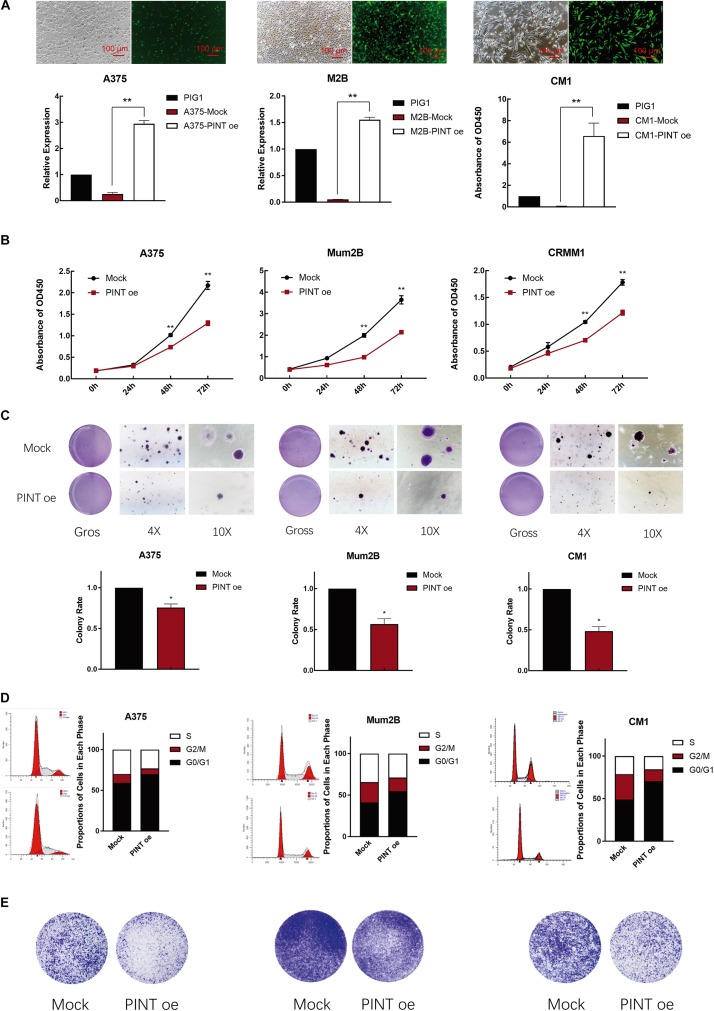
FIGURE 3.
LINC-PINT inhibited melanoma progression in vitro. (A) The LINC-PINT overexpression plasmid was stably transfected into A375, Mum2B and CRMM1 cells, and the plasmid also contained the EGFP tag. Scale bars: 100 μm. Real-time PCR results showed significantly higher expression of LINC-PINT in A375-PINT oe, M2B-PINT oe and CM1-PINT oe cells. ∗∗P < 0.01. (B) CCK8 assay was performed to assess cell proliferation in the Mock and LINC-PINT overexpression melanoma cells. ∗∗p < 0.01. (C) Colony count statistics demonstrated tumor formation ability. The colony count statistics showed a significant reduction in the numbers of LINC-PINT overexpressed A375, Mum2B and CRMM1 cells. The colony numbers were determined from three independent soft agar plates. ∗∗P < 0.01. (D) Cell cycle analysis by flow cytometry was performed to determine the percentage of cells in different cell cycle phases. The percentage of cells in G0/G1 phase increased after LINC-PINT overexpression in A375, Mum2B and CRMM1 cells. All histograms showed the percentage (%) of cell populations from one independent experimental group. (E) The migration and invasion abilities of LINC-PINT overexpressed melanoma cells were detected by transwell assay.

